
Bowling Statistics in Cricket: Average, Economy, Strike Rate
 Available in US
The Three Numbers That Define a Bowler on a Live Feed
When I started coaching at a local club, one of the first things I had to explain to new players was why their bowling figures looked different from what they imagined. A bowler who had taken three wickets and gone for 45 runs in 10 overs felt like they had bowled well — they had three wickets — but the economy of 4.5 was high for a club T20, and their strike rate of 20 balls per wicket was unremarkable. The three core bowling numbers tell different parts of the same story, and a bowler whose average looks good might have a poor economy, while a bowler with a brilliant economy might be taking too few wickets to actually win matches.

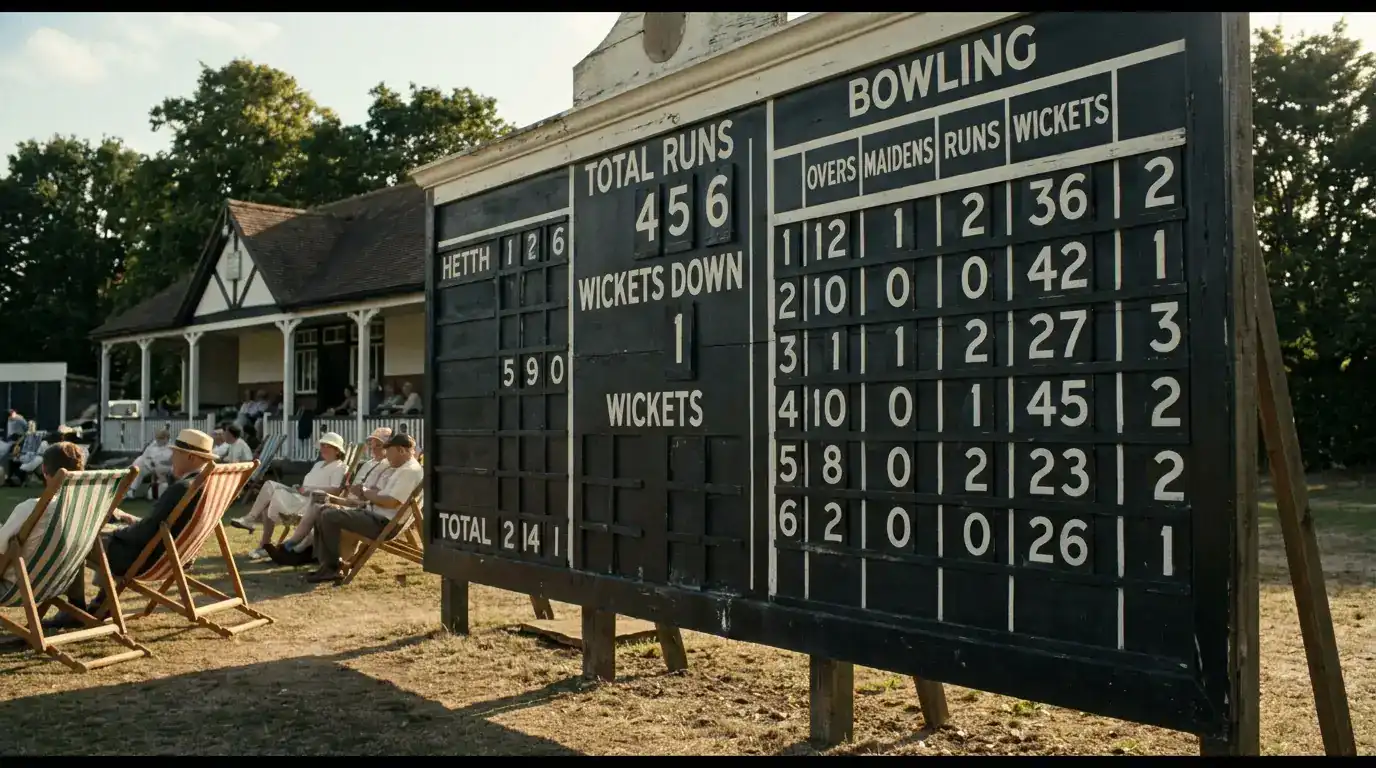
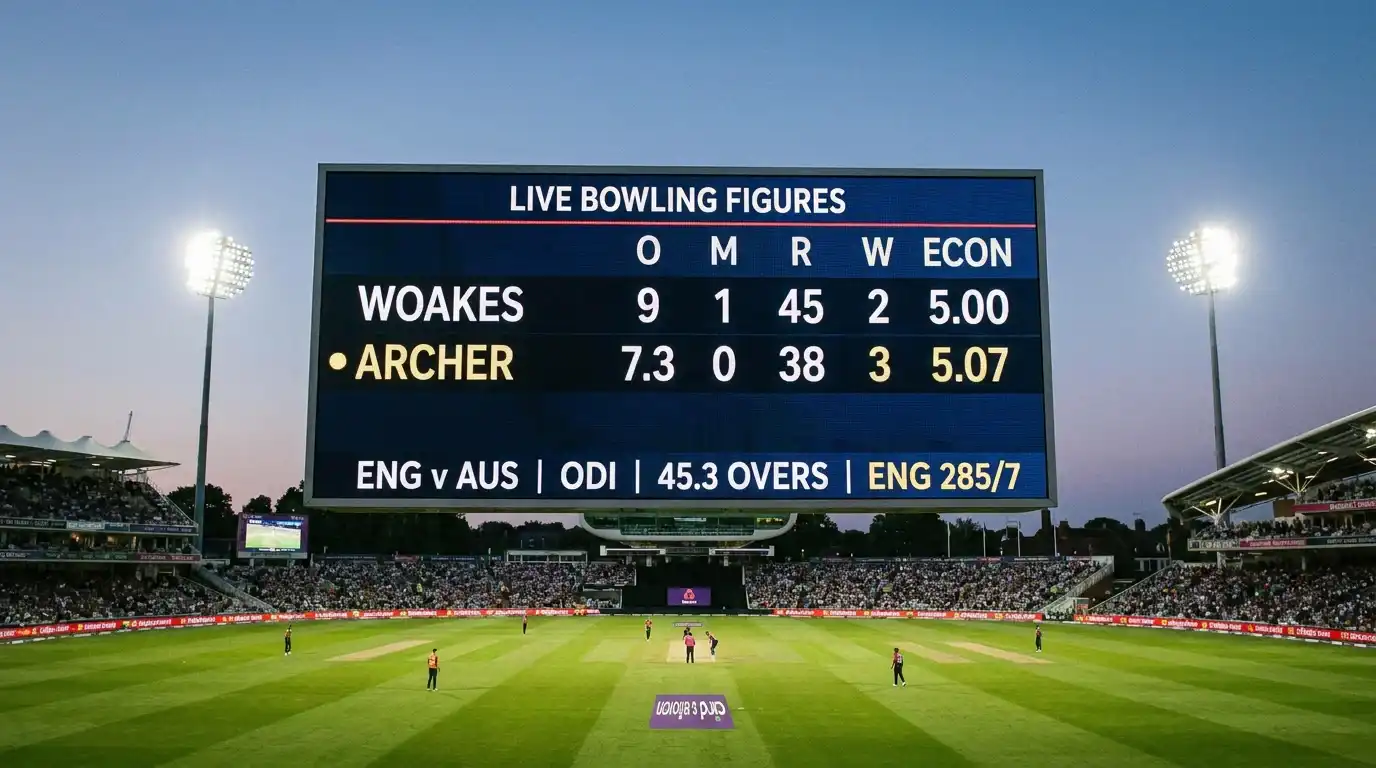
On a modern cricket scorecard or live feed, bowling figures appear in a compressed format: overs delivered, maidens bowled, runs conceded, wickets taken. From those four numbers, three derived statistics are calculated — average, economy rate, and bowling strike rate. The three derived numbers are where most viewers focus their analysis, and each of them measures something genuinely different about the bowler’s effort. Around 15 percent of Test wickets now involve a DRS review at some stage of the dismissal, and the technology’s accuracy — Hawk-Eye is reported with a ±5 millimetre first-contact precision and ±2 millimetre algorithmic uncertainty in its predictive path — means the figures behind those wickets are now more reliable than they were a generation ago.
Bowling Average and Why Lower Is Better
The bowling average is calculated by dividing the total runs conceded by the number of wickets taken. A bowler who has conceded 600 runs and taken 30 wickets has an average of 20. Unlike batting, where higher is better, bowling rewards lower numbers — fewer runs per wicket means the bowler is producing wickets more cheaply.
Test cricket bowling averages cluster in a much wider band than batting averages. An exceptional Test bowler will sustain an average in the low 20s across a long career. A good Test bowler will sit in the mid to high 20s. A serviceable Test bowler operates in the low 30s. Above 35 is generally considered insufficient for a long career at the top level. The narrow band reflects how hard it is to take Test wickets cheaply — the format gives batters time, the pitch gives them options, and the bowling side needs to manufacture pressure across long sessions.

In limited-overs cricket the averages shift upward because the format gives batters less time to accumulate runs but also gives bowlers fewer balls to take wickets in. ODI averages in the high 20s are healthy. T20 averages in the low 20s are excellent. The Hundred uses the same wicket-taking conventions as T20 — a bowler who takes 20 wickets in a season at an average of 22 has had a strong year.
The bowling average’s main weakness is its insensitivity to context. A bowler who takes wickets cheaply on green seaming surfaces but struggles on flat batting pitches will have an average that looks attractive in some conditions and disastrous in others. Modern selection teams look at averages broken down by venue, surface type, and opposition, rather than the headline number alone.
Economy Rate and the Format-Specific Goal
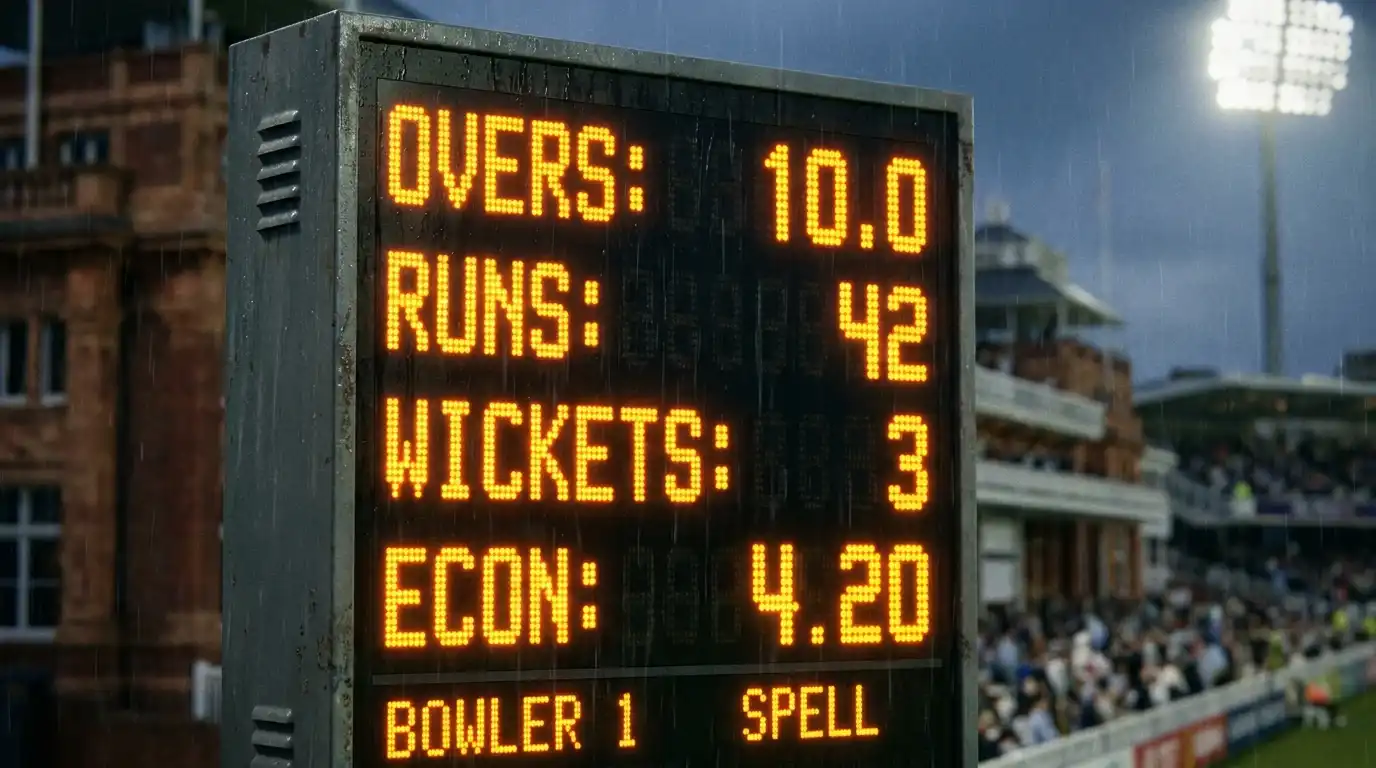
Economy rate measures runs conceded per over. A bowler who has gone for 36 runs in 9 overs has an economy of 4.0. The number is calculated continuously through an innings and is updated on the live feed after every over.
The format-specific baseline for economy is the main source of confusion. In Test cricket, an economy of 3.0 is excellent, 3.5 is normal, and above 4.0 is poor. In ODI cricket, the bands shift upward: 5.0 is healthy, 6.0 is normal, and above 7.0 is poor. In T20 cricket, the entire scale shifts dramatically — an economy of 7.0 is excellent, 8.0 is normal, and above 9.0 is becoming a problem. T20 batters score so quickly that an economy below 7 indicates a bowler whose dot balls and length deliveries are forcing genuine pressure.

The Hundred sits between T20 and the other formats in terms of economy. The 100-ball innings produces a slightly different scoring rhythm — five-ball sets compress the scoring window — and a Hundred economy of around 7.0 is typical for a successful bowler. The 2024 County Championship’s shift toward spin, with spin bowlers delivering 37 percent of overs (1,035 in 2024 versus 767 in 2023), produced lower economy rates in the long format, since spinners with full fields and slow surfaces tend to concede fewer per over than fast bowlers under attack.
What economy rate hides is who the bowler is bowling to and when. A bowler who delivers his quota in the powerplay against attacking openers may finish with an economy of 7.5 in T20 — which looks ordinary — but might have been bowling brilliantly against the toughest phase. A bowler who bowls his overs in the middle phase against settled batters going for 8 an over might have an identical economy but have produced much less impact. The phase-adjusted economy is now a standard analytical tool, but it does not appear on most live scoreboards.
Bowling Strike Rate as a Wicket-Taking Measure
Bowling strike rate is the number of balls a bowler typically delivers between wickets. A bowler who has bowled 600 balls and taken 30 wickets has a strike rate of 20 — one wicket every 20 balls, or roughly every three and a third overs.
Bowling strike rate is the cleanest measure of wicket-taking efficiency. It does not depend on the runs conceded; it measures only how quickly the bowler is removing batters. A strike-bowler-type player — someone selected primarily to take wickets — will have a strike rate well below the team average, even if their economy is unspectacular. A bowler selected to dry up runs may have a strong economy but a high strike rate, since they are containing rather than attacking.
The format scales bowling strike rate just as it scales the other numbers. In Test cricket, a strike rate of 50 means the bowler takes a wicket roughly every 8 overs — that is fast for a Test bowler, the kind of figure produced by a fast bowler on his best pitches. A strike rate of 70 is normal for a Test bowler across a career. In T20 cricket, strike rates of 16 to 18 are typical for a wicket-taking bowler.
For coaches and selectors, the strike rate is often the most important of the three numbers because it directly measures the rate at which the bowler is producing the events (wickets) that win matches. A bowler with a low strike rate and a high economy is a wicket-taker who concedes runs to take them — sometimes the right trade-off for the bowling side. A bowler with a high strike rate and a low economy is a containment bowler who dries up runs without taking wickets — sometimes also the right trade-off, depending on the match situation.
How These Three Diverge for Spin and Pace
Spin and pace bowlers produce different statistical profiles across the same three numbers, and a side selecting a balanced attack needs to read the numbers in context of the bowler type.
Fast bowlers in Test cricket typically have lower bowling strike rates than spinners — they take wickets faster, in fewer balls — but their economy rates are usually higher because batters can attack pace deliveries with more boundary options. A typical Test fast bowler’s career might show an average of 28, an economy of 3.3, and a strike rate of 50. The numbers describe a wicket-taker who concedes runs faster than a spinner but takes wickets more efficiently.
Spinners reverse the profile. A Test off-spinner or leg-spinner often has a strike rate of 65 to 75 — wickets come more slowly — but an economy below 3.0 because spin bowling at Test pace is harder for batters to attack consistently. The 2024 County Championship’s spin spike, when spin overs jumped to 1,035 from 767 the previous year, illustrates the structural difference. Counties leaning on spin produced lower team economies and slower wicket-taking patterns than those leaning on seam.
In T20 cricket the picture flips again. T20 fast bowlers concede more economy than they would in Tests, but their strike rates remain low because the format compresses the wicket-taking window. T20 spinners, especially mystery spinners and wrist-spinners, often have the best economies of any bowler in the format — they are harder to hit because the variations are harder to read in the short time available.
For a coach selecting a side, the question is rarely “who has the best numbers” and more often “which bowler’s strengths complement the rest of the attack”. A side that already has containment spinners needs a strike-bowling pace option; a side dependent on fast bowlers may need a defensive spinner to control the middle overs. The numbers help diagnose the gap.
If you want a closer look at how these bowling figures sit alongside the rest of the live scorecard, there is more on that in our scorecard reading guide.
Published by the Stumply team.
