
How to Read a Cricket Scorecard: A Field Guide for UK Viewers
 Available in US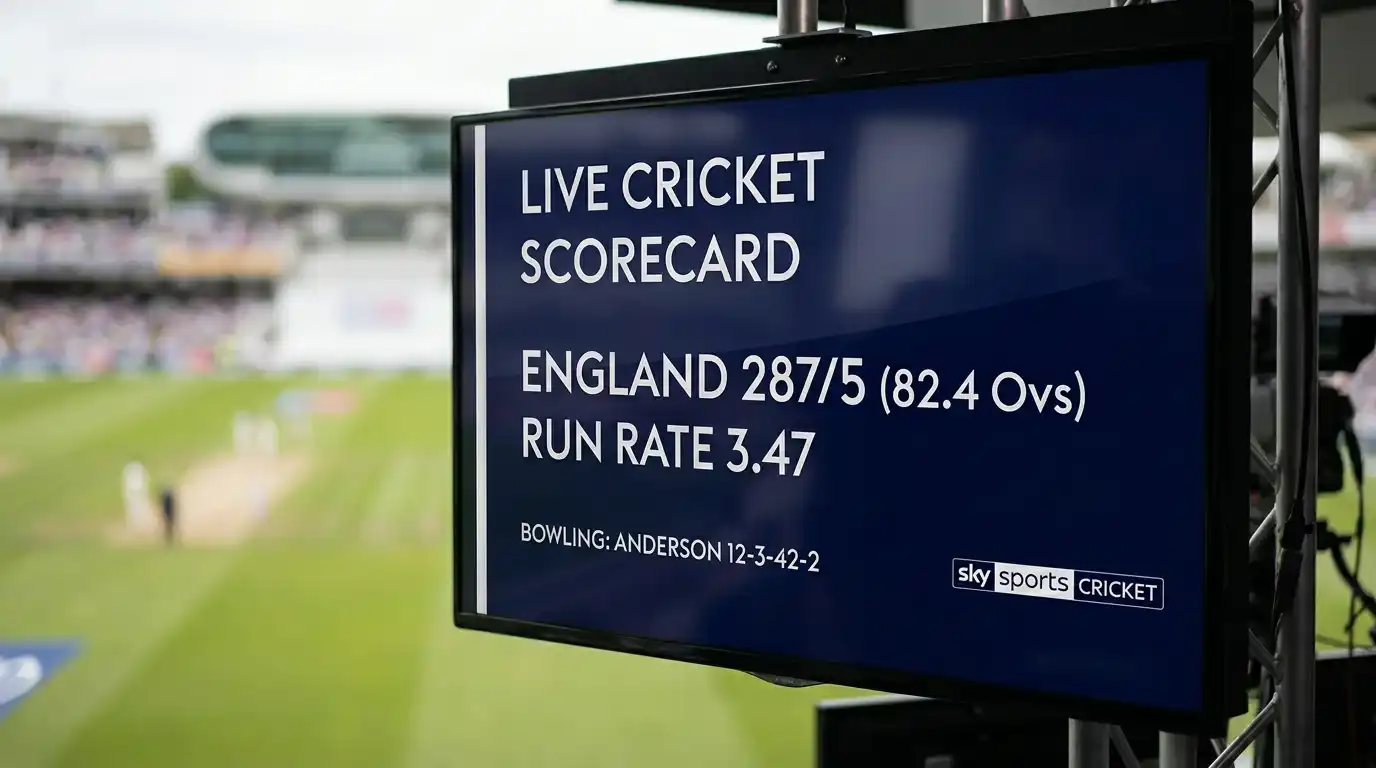
What a Live Scorecard Is Actually Telling You
The first scorecard I ever properly walked someone through was on a county ground in 2017. The man next to me kept asking what “127/3 (38.4)” meant. He was a football supporter dragged along by a colleague, and once I started annotating the screen for him he didn’t shut up all afternoon. Nine years later I’m still doing the same thing, just at scale.
A live cricket scorecard is not, despite first impressions, a wall of random numbers. It is a strict little spreadsheet of facts ordered by tradition — and once you know what each cell answers, the whole match opens up. The top line tells you the score. The batting card tells you how it was made. The bowling card tells you who tried to stop it and how that went. The extras line confesses what nobody managed. The over counter and the ball-by-ball strip wedge in the time axis. That is essentially everything.
The bit that catches new viewers off-guard is that the same scorecard skeleton stretches across formats that look nothing like each other. A five-day Test and a 100-ball Hundred game use the same boxes. Only the proportions shift — which is why a scorer can move from Lord’s to a club ground in Essex and not retrain a thing. DRS, the review technology I’ll keep mentioning, is involved in roughly 15% of all wickets in Test cricket, and almost all of them show up on the card with a tiny annotation that most casual viewers ignore.
This guide walks every box, every abbreviation, every quietly important number. By the end you should be able to glance at any feed — Sky, BBC Sport, the ECB Match Centre, a county club’s own widget — and read the state of play in about six seconds. Which is roughly the time it takes a fast bowler to walk back to their mark.
The Top Line: Team Total, Wickets, Overs
Ask a cricketer to summarise a match in five characters and they’ll write something like “248/7”. That is the top line, and it is doing more work than any other piece of text on the page. Two numbers separated by a slash, sometimes flanked by an over count and a bracketed letter. Everything else on the scorecard is the audit trail behind those digits.
The first number is the team’s total runs. The second is the wickets lost. So “248/7” means 248 runs scored, seven batters out, three left in the shed. In Australia the convention flips — wickets first, then runs — so a fixture in Sydney might read “7/248” for the same thing. UK scorecards stick to runs-first across all formats and on every domestic and broadcast feed I’ve worked with.
Then come the overs. “248/7 (62.3)” means 62 completed overs and three legal balls into the 63rd. An over is six legal deliveries. Wides and no-balls don’t tick the counter forward, which is why an over can take eight balls to finish on a particularly scruffy evening session at Edgbaston. In The Hundred the counter looks different — it shows balls remaining out of 100 — but the principle is identical: how much fuel does this innings have left.
The little letters at the end change the meaning entirely. A “d” stands for declared. A team writes “248/7d” when the captain has voluntarily ended the innings before all ten wickets fell, betting that 248 is enough to bowl the other side out twice. The follow-on signal “f/o” means the team batting now is doing so under instruction — they were 200-plus runs behind and got asked to bat again. “all out” or simply “248” with no slash and no overs left is self-explanatory. And in limited-overs cricket you’ll see the bracketed overs hit the maximum (20.0 for T20, 50.0 for ODI) when the side has used its quota.
One quiet detail that catches people out: the top line will sometimes show a target alongside the current total — “187/3 chasing 250”. In a rain-affected match that target may carry a DLS asterisk, meaning the figure has been recalculated. If you see “DLS par 174”, the chasing side needs to be ahead of 174 at exactly that point in their innings to be on the winning side of the equation. We’ll return to par scores properly in a later section, but on the top line that asterisk is a flag telling you the maths just shifted.
Read the top line aloud and you have the match in one breath. England, 248 for 7 declared, off 62 overs. The next person you tell can decide instantly whether to keep watching.
The Batting Card Row by Row
The batting card is the bit that hooked me on cricket scorecards as a teenager. It reads like a CV — name, role, fate, output — and you can usually guess the shape of a session just by skimming the right-hand columns. A batter who’s been in 40 minutes and faced 60 balls for 12 runs has done a different job to a number eight who walked in 15 minutes ago and lashed 30 off 12.
Each row is one batter, in the order they walked to the crease. Left to right: name, then a description of how they were dismissed, then runs scored, balls faced, fours, sixes, and strike rate. That’s the canonical layout on Sky, BBC Sport, the ECB Match Centre and on every county club’s scorecard widget. Cricbuzz and ESPNcricinfo throw in additional columns — minutes batted, dot-ball percentage — but the core six stay constant.
Strike rate is the column newcomers most often misread. It is runs per 100 balls, not runs per ball. A batter on a strike rate of 78.5 is scoring at 78.5 runs per 100 deliveries. In a Test that’s an aggressive day. In a T20 that’s slow, possibly dangerously so. A T20 opener on a strike rate of 78 is leaking pressure onto their partner, which is why broadcasters cut to graphics showing the gap between current strike rate and “required” strike rate at this stage.
The asterisk next to a name means that batter is currently not out and at the crease. Two asterisks across the card and you’ve found your batting pair. A small “n.o.” after the runs (“47 n.o.”) repeats the same information for the static post-innings card, where the live asterisks no longer apply. The captain is marked with a “(c)” after their name; the wicketkeeper carries “(†)” or sometimes “(wk)” depending on the platform.
Dismissal text is its own micro-language. “c Smith b Anderson” means caught by Smith, bowled by Anderson. “lbw b Anderson” is leg-before-wicket to Anderson, no fielder involved. “run out (Stokes/Bairstow)” credits the fielder who threw and the keeper who completed. “st †Foakes b Leach” means stumped — the keeper whipped the bails off while the batter was out of their crease, with Leach’s delivery as the catalyst. Every one of these codes maps to a numerical bowler credit further down the card.
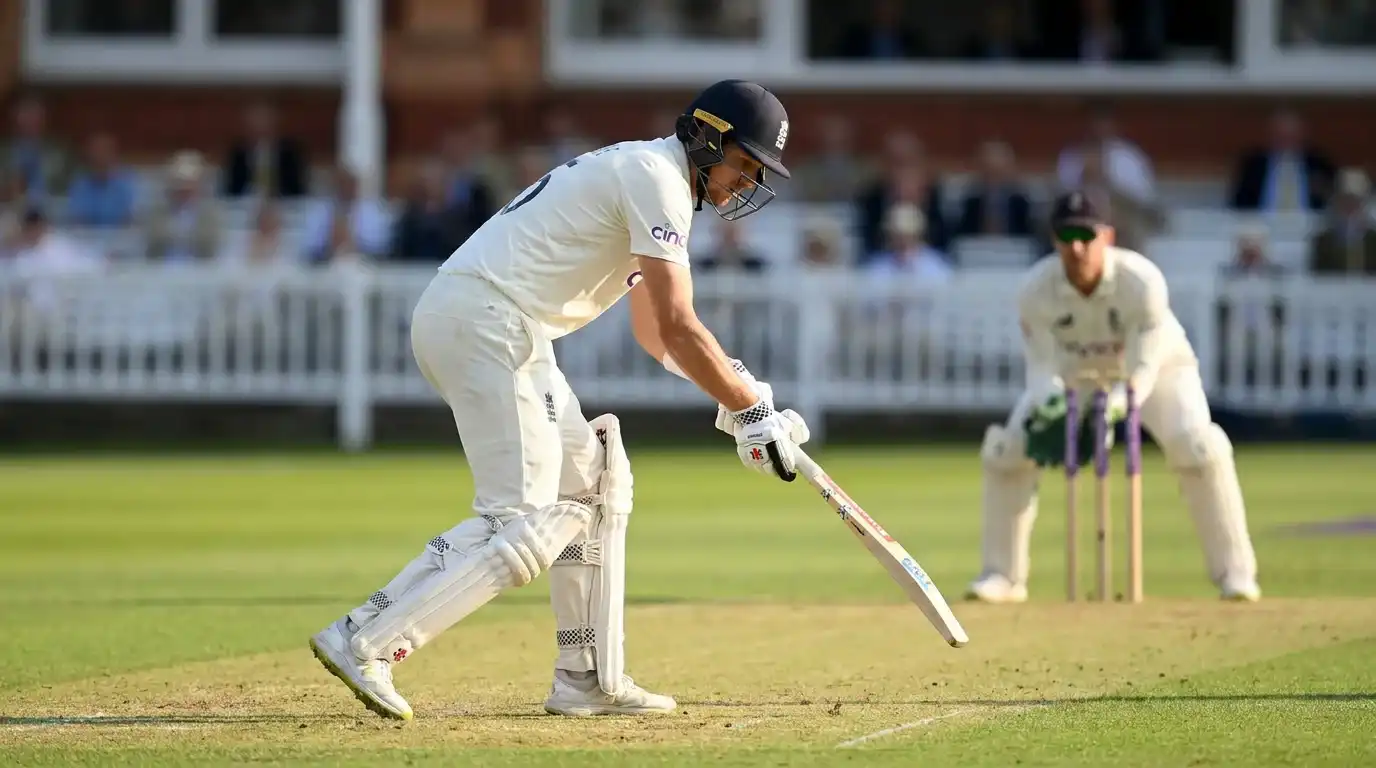
The strike rate to balls-faced ratio is where a careful reader spots stories broadcasters haven’t gotten to yet. A wicketkeeper-batter on 12 off 47 balls is anchoring a recovery. A number three on 90 off 95 balls is hitting through the line with confidence. Cricket scorecards reward staring at them for a few seconds longer than feels natural.
The Bowling Card and What “Economy” Really Means
I once watched a county fast bowler walk off after spell figures of 0-12 from six overs and seem genuinely thrilled. The captain bear-hugged him on the boundary. The crowd looked confused. Those numbers told the whole story to anyone reading the bowling card properly: he hadn’t taken a wicket, but he’d choked the run rate to two per over in a 50-over match, which in the middle stage of an innings is exactly what the team needed.
The bowling card sits below the batting card and uses a different unit. Each row is one bowler. Columns, left to right: name, overs bowled, maidens delivered, runs conceded, wickets taken, economy rate. Often a seventh column for dot-ball percentage. The full international standard adds wides and no-balls separately, broken out from the runs total.
The overs column shows partial overs as decimals. A figure of “4.3” means four completed overs and three legal deliveries into a fifth. That fifth over is “live” and will fill in over the next few minutes. Maidens — overs in which zero runs are scored — appear as a count, not a percentage. Even one maiden is worth boasting about in a T20. In Tests, an opening bowler will routinely rack up five or six maidens in a morning session, and the captain will use that number to decide whether to keep them on.
Economy rate is runs conceded per over. It is the column that defines a white-ball career. In T20 anything under seven is good, under six is excellent, under five is exceptional. In ODI cricket the bar shifts to around five-and-a-half being competent. In Tests economy matters less because the bowler’s primary job is wickets — but in a defensive phase, captains track economy to spot the moment a bowler starts leaking.
One trap. Economy isn’t a clean efficiency metric on its own. A bowler can have a beautiful economy of 4.8 and a useless average of 65, because they haven’t taken any wickets. A bowler can carry an ugly economy of 9.2 and still be the match-winner because they took 4-46 in four overs. The bowling card always needs reading as a pair of numbers — economy plus wickets — and that pair is the closest thing cricket has to a productivity score for a bowling spell. The 2024 County Championship saw spinners deliver 37% of overs in Division One, up from 17% the year before, and the economy story for those spinners shifted dramatically as a result.
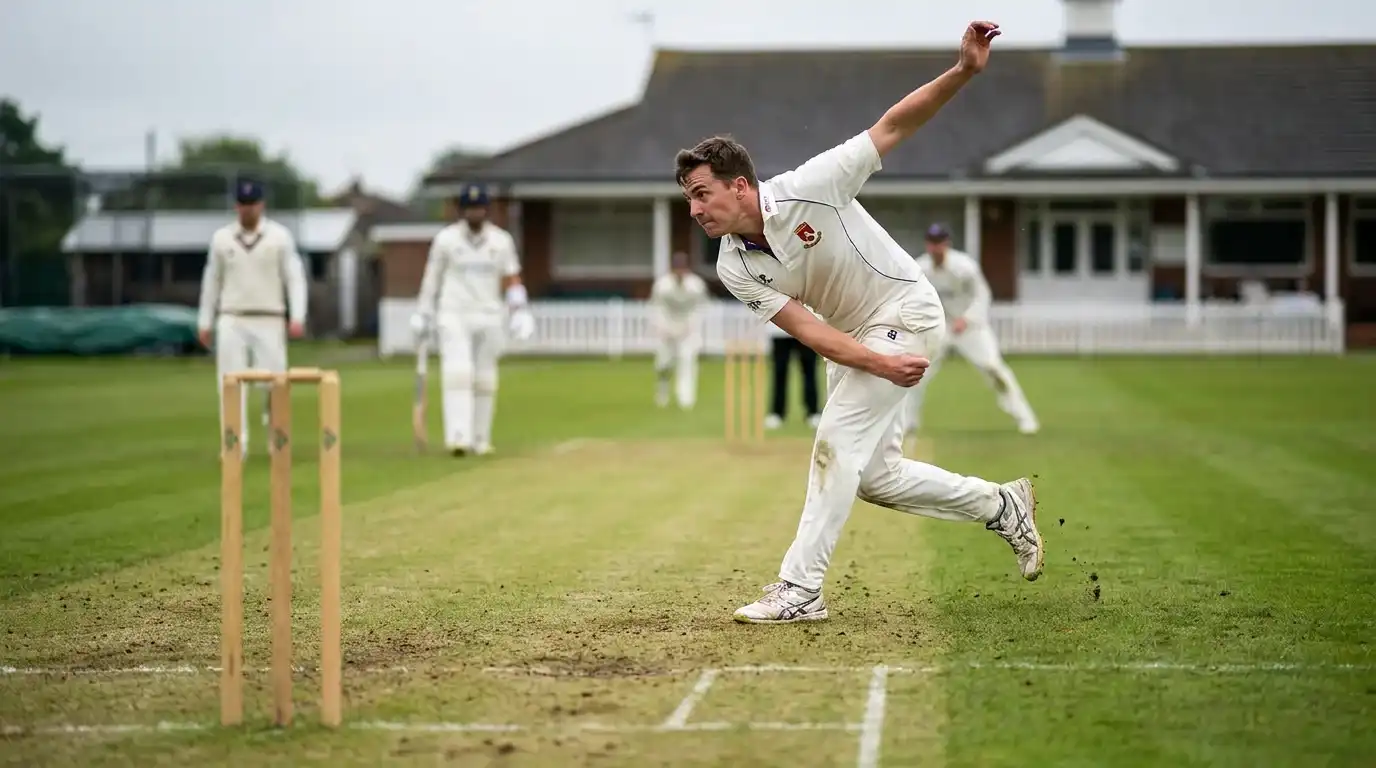
Wickets are shown as a single integer, never as a fraction. Below the card a separate “fall of wickets” line tells you the order: “1-15 (Smith, 4.2 ov), 2-67 (Brook, 18.4 ov)” means the first wicket fell at a team total of 15 inside 4.2 overs, the second at 67 inside 18.4. That sequence — wicket number, team total, who fell, when — is how a coach reconstructs whether a collapse was a cluster or a steady bleed.
The bottom of the bowling card always carries totals. Total overs delivered, total maidens, total runs conceded (which must equal the batting side’s total minus extras awarded to the team rather than to individual bowlers), and total wickets. Those four numbers are the audit. If they don’t reconcile to the top line, the scorer has made a mistake somewhere, and any decent feed will quietly correct it before you notice.
Extras, Modes of Dismissal and Footnotes
Extras are the most underrated line on a scorecard. They tell you, in a single number, how disciplined the bowling side was — and in a tight T20 finish those extras are routinely the margin of victory. A team that conceded 18 extras and lost by 14 runs has lost the match in its no-ball line, not its top-order collapse.
The extras line sits under the batting card, separated by a faint divider on most modern feeds. It reads as a single total with a parenthesised breakdown: “Extras 21 (b 4, lb 7, w 8, nb 2, p 0)”. Those five categories are byes, leg-byes, wides, no-balls and penalties. Each behaves differently in scoring terms.
Byes (b) are runs scored from a delivery that beat both bat and batter — the keeper missed it, or the ball went away to fine leg untouched. Leg-byes (lb) are runs scored when the ball strikes a part of the batter that isn’t the bat or the gloved hand below the wrist. Both are charged to the team total but not to the individual bowler’s analysis. Wides (w) and no-balls (nb) are charged to the bowler’s analysis and force the bowler to deliver another ball. Penalty runs (p) are awarded in fives, only on serious infractions — slow over-rate, deliberate damage to the pitch — and you almost never see them above zero in UK domestic cricket.
Modes of dismissal each have a fixed shorthand. Bowled is just “b Anderson”. Caught is “c [fielder] b [bowler]” — caught by the fielder named, off the bowler named. Caught and bowled, when the bowler catches their own delivery, is “c & b Anderson”. Leg-before-wicket is “lbw b Anderson” with no fielder. Stumped is “st †[keeper] b [bowler]”. Run out is “run out ([fielders involved])”. Hit wicket — when the batter dislodges their own bails — is “hit wicket b Anderson”. Obstructing the field, handled the ball and timed out are theoretically possible and so vanishingly rare that they barely warrant a shorthand, but if they happen they appear in plain English.
Retired hurt and retired out are subtly different. “Retired hurt” means the batter left the field injured and may return; it doesn’t count as a dismissal. “Retired out” is voluntary — usually in The Hundred or T20 when a captain swaps in a power hitter — and it does count, with the wicket added to the team total but not credited to any bowler.
One footnote I get asked about constantly. The “DNB” abbreviation next to a name at the foot of the batting card means “did not bat”. The team’s innings ended before that player walked out. It’s not a slight — number elevens routinely show “DNB” if the team folded for 110 and the tail held together. The “absent” tag below — usually “absent hurt” or “absent ill” — is rarer and tells you the player was unavailable to bat at all.
Ball-by-Ball: How a Live Feed Is Built
Open Cricbuzz or ESPNcricinfo during a live match and you’ll find a strip running down the right-hand side that updates every ten to fifteen seconds. That strip — six little numbers and letters per over, scrolling upward — is the ball-by-ball feed, and it is the rawest form of cricket data available to the public. The Cricbuzz Android app sits on over 100 million downloads largely because that strip exists.
Each ball is represented by a token. A digit “1”, “2”, “3” or “4” is straightforward — runs scored from that delivery. A “0” or a dot is a dot ball. A “6” is a maximum. “W” is a wicket. “wd” is a wide, “nb” a no-ball, “lb” a leg-bye, “b” a bye. Tokens are read left to right within an over, with the over total in brackets at the end of the line. So “1 0 4 W 0 2 (7)” tells you: single, dot, four, wicket, dot, two — over yielded seven runs and a wicket.
The scorer behind that feed sits in the ground itself, watching deliveries through binoculars on a cabled laptop. For international matches there’s a backup scorer running a parallel sheet, and the two streams are reconciled in real time. Cricbuzz currently produces around 398 million monthly visits to its site.
Each ball-by-ball token usually unrolls into a one-line commentary when you tap it. The line will read something like “62.3 Anderson to Smith, no run, defended off the back foot to mid-off”. That five-word description is the work of one human typing while the next delivery is loaded into the bowler’s hand. The latency from real-life event to public app — for a top-tier feed — is roughly five seconds. On a county club’s own app it can be twenty.
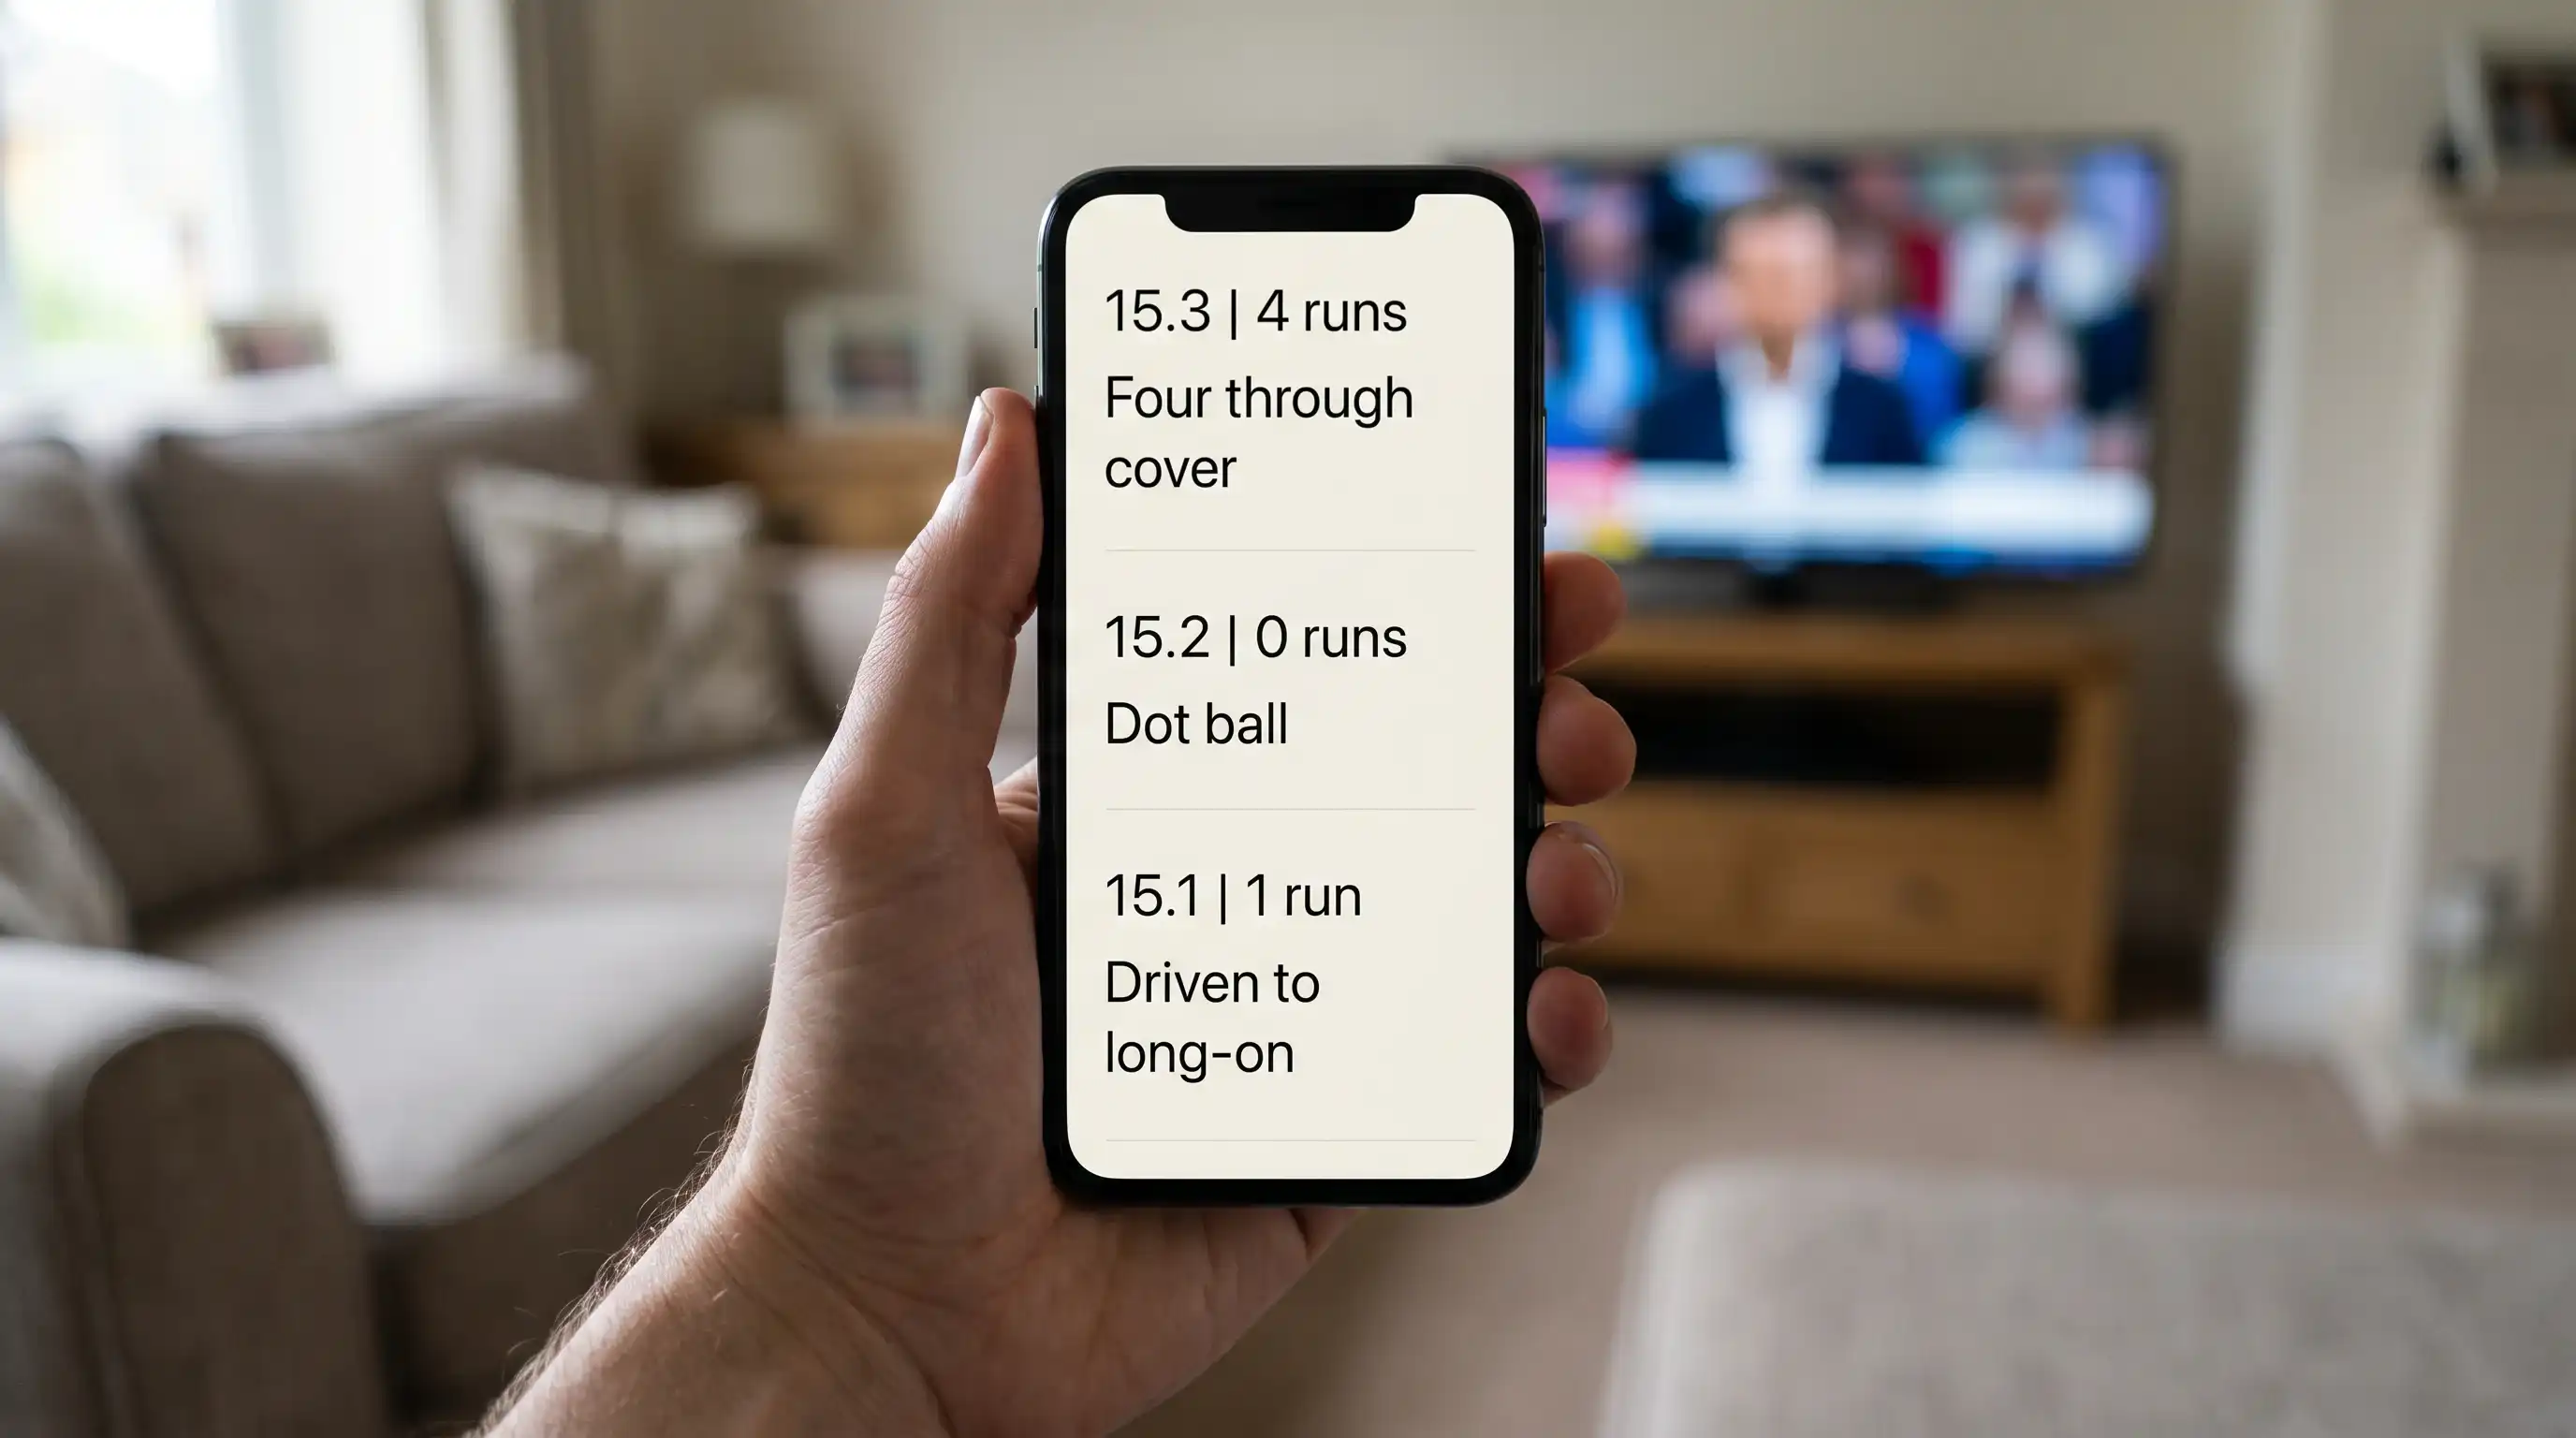
The reason the feed exists in this strict shorthand is so it can be rebuilt later. Every Manhattan graph, every wagon wheel, every “scoring zones” heat map you see at the end of a session was built from the ball-by-ball file. Strip the format away and you have an absolute time-series of cricket events, which is why advanced fantasy and stats sites lean on the feed rather than the static scorecard. Hawk-Eye founder Paul Hawkins once said, “More and more batsmen try and get away with not walking. But we experimented in the nets and found that even the smallest edge is detected.” That’s the same data discipline now applied to wickets: every event is logged at micro-resolution, and the ball-by-ball line is the public face of that log.
One trap for new readers: the ball-by-ball strip resets visually at the end of each over, but you can scroll back through previous overs to see the shape of an innings. A long run of dot balls is more visible there than on the static card. A bowler conceding “0 0 0 0 0 W” has just constructed a maiden into a wicket maiden, and you’d see the pressure mount across the row before the W happens.
Run Rate, Required Run Rate and Asking Rate
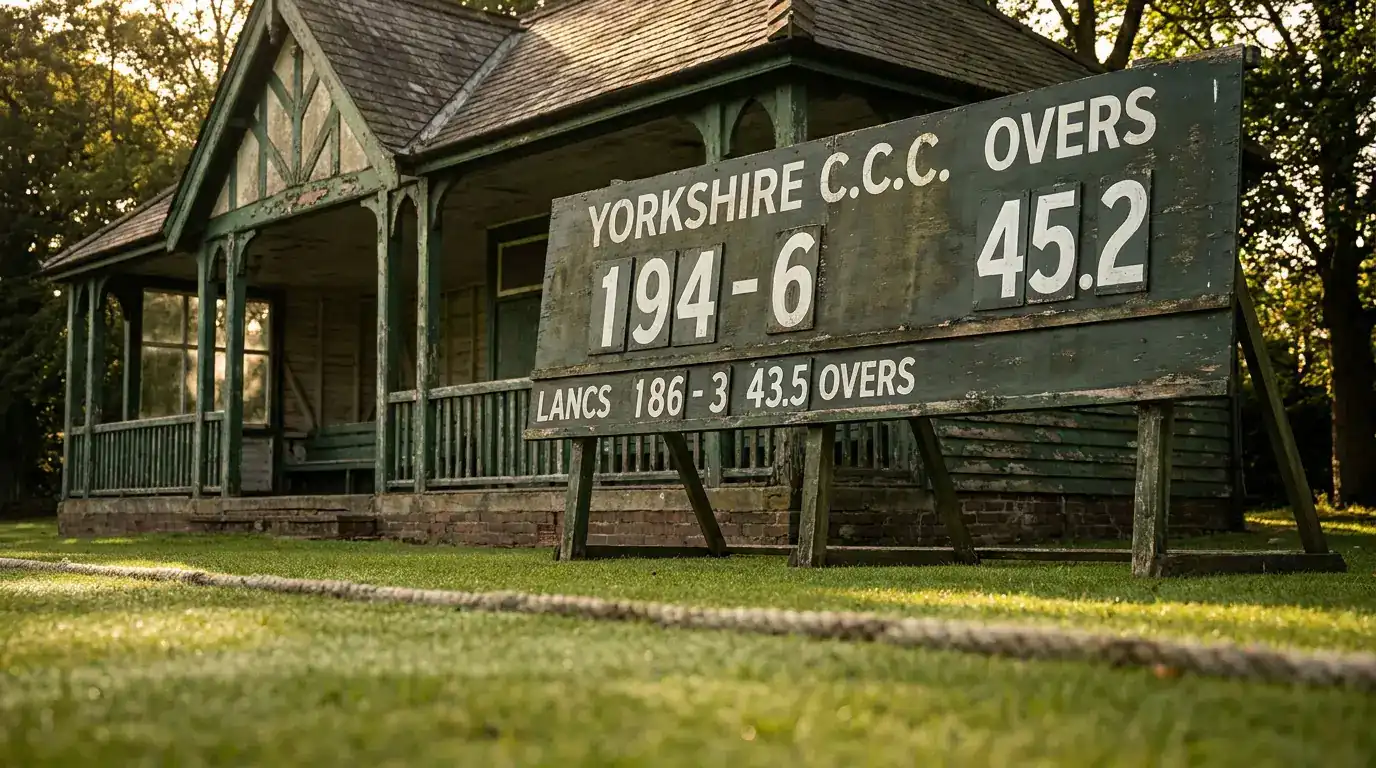
Run rate is the single number that tells you whether a chase is on. It sits on every live scorecard, usually top-right, and most viewers glance at it before they look at anything else.
On a live feed you’ll see two run-rate values: current run rate (CRR) — the team’s actual scoring pace — and required run rate (RRR), which appears only in the second innings when there’s a target. CRR is runs scored divided by overs faced. So a team on 187 from 32 overs has a CRR of 5.84. RRR is runs still required divided by overs remaining. A team needing 80 from the last 12 overs has an RRR of 6.67.
CRR almost always sits below or beside the team total in the header strip. RRR — when relevant — appears immediately under it, often in a slightly bolder weight on UK broadcast graphics. The Hundred uses a different denominator (balls remaining out of 100, not overs) but the calculation philosophy is identical.
Pay attention to the gap between the two numbers, because that gap is the match. If CRR is 6.8 and RRR is 6.1, the chasing side is comfortable. If CRR is 6.8 and RRR is 9.4, they’re falling behind a ball at a time and the bowler knows it. UK broadcasters use a “required run rate” graphic that pops up roughly every five overs in white-ball cricket; on Sky those graphics are pre-baked from the same data feed the scorecard uses.
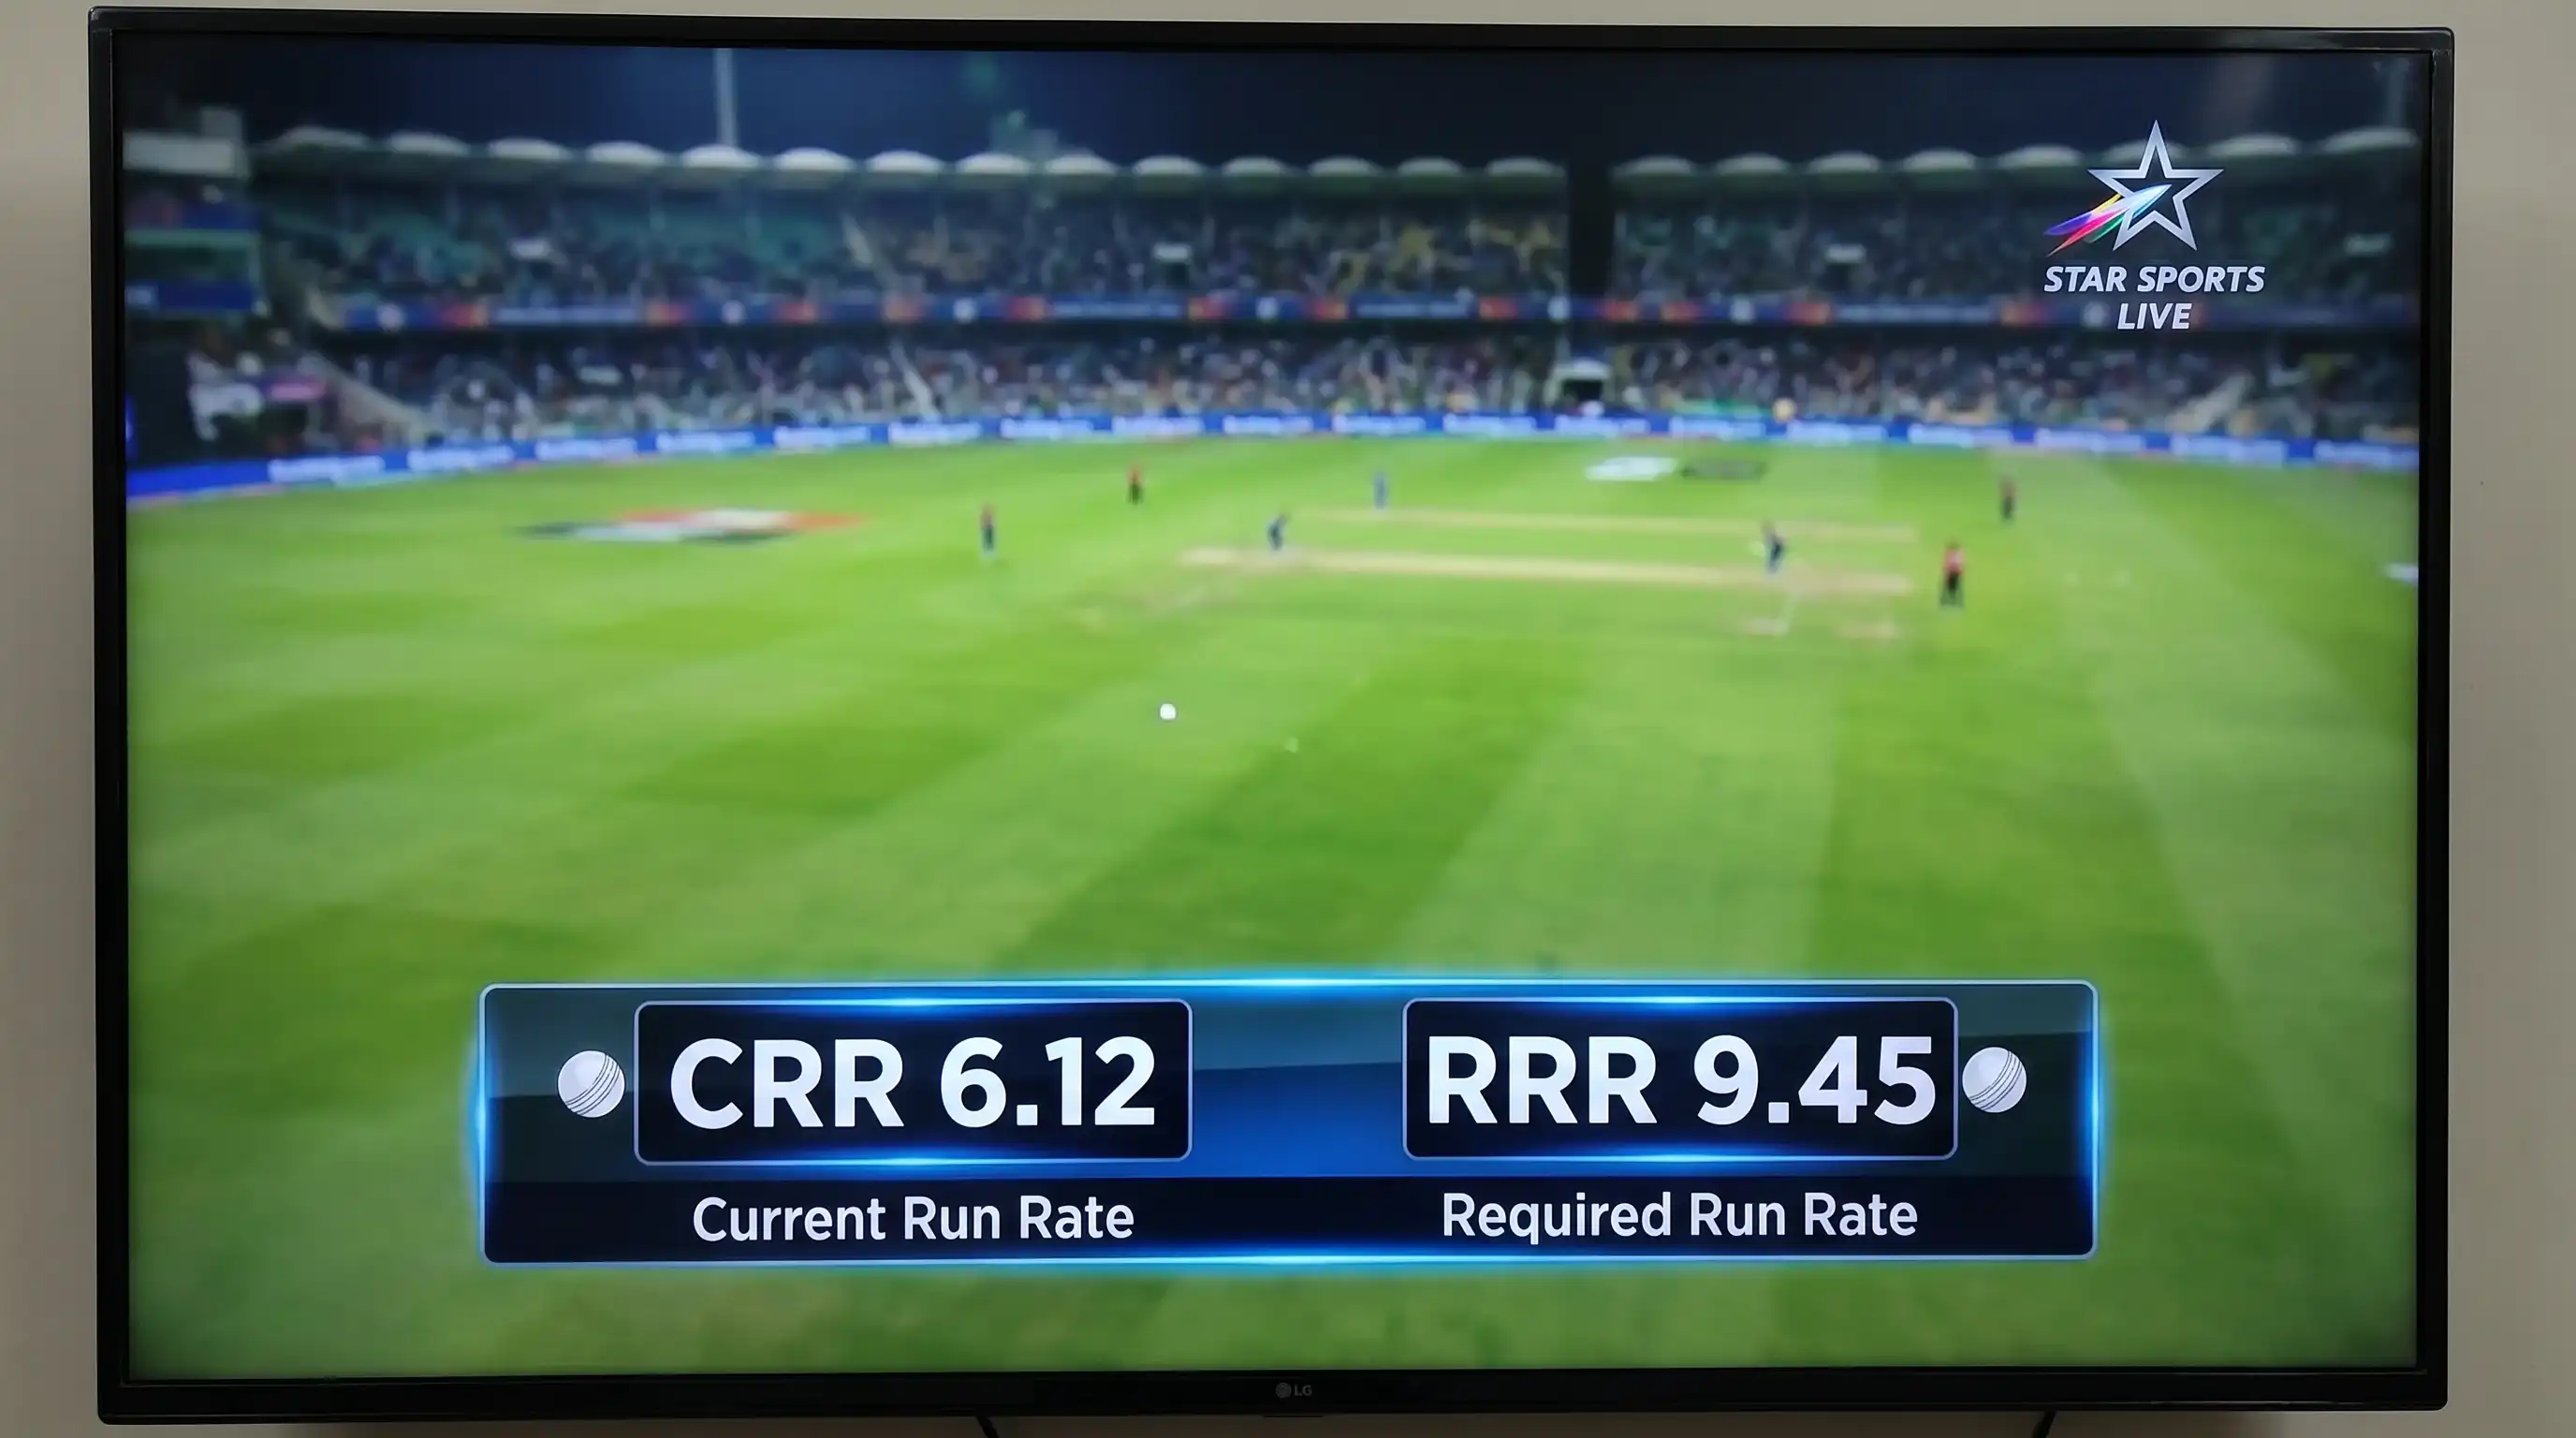
For full worked examples of how the maths reshapes ball by ball, that’s a deeper topic in its own right. On the scorecard itself, what matters is where the numbers sit, what they’re called, and how to read the gap between them at a glance.
In Test cricket, run rate is shown on the scorecard but it doesn’t mean much in isolation. There’s no target to chase against the clock, so RRR isn’t displayed. CRR in a Test is more of a tempo indicator — useful for spotting whether the batting side is going for declaration runs or grinding for safety. A run rate of 4.5 in a Test session is fast scoring; 2.1 is grinding. Spinners contributed 1035.4 overs in the 2024 County Championship at lower run rates than the seamers, and that shifted what “normal” looked like for Test-style scoring inside the four-day domestic game.
Cricket Scorecard Abbreviations You Will See
There are roughly forty abbreviations on a standard cricket scorecard, and most are intuitive once you know what they’re shortening. A few are not, and those are the ones that cost casual viewers their bearings.
The big batting-card abbreviations: R for runs, B for balls faced, 4s for boundaries, 6s for sixes, SR for strike rate. On the bowling card: O for overs, M for maidens, R for runs conceded, W for wickets, Econ or ER for economy rate. Around a batter’s name: (c) for captain, (†) or (wk) for wicketkeeper, an asterisk for not out at the current moment. Around a bowler’s name: an asterisk usually means they’re the bowler currently in operation.
On the top line: “d” for declared, “f/o” for follow-on, the bracketed overs total (or balls remaining in The Hundred). Around the target in a chase: “DLS” or “D/L” for a recalculated target, “par” for the in-progress benchmark in a rain-affected match.
Dismissal abbreviations: b for bowled, c for caught, lbw for leg-before-wicket, st for stumped, ro for run out (sometimes written in full), hw for hit wicket, c&b for caught and bowled. Each is followed by the bowler’s surname, and where applicable the fielder’s surname.
Extras: b for byes, lb for leg-byes, w or wd for wides, nb for no-balls, p for penalty runs. Be careful not to confuse “b” in an extras line (byes) with “b” as a dismissal (bowled). Context makes the difference obvious — extras sit under the batting card as a single row, dismissals appear inline beside each batter.
Less common but still standard: DNB for did not bat, Abs for absent (with “hurt” or “ill” appended), RH for retired hurt, RO for retired out, sub for substitute fielder, P for partnership when shown between batters.
Specialist columns that have crept onto modern feeds: SR/100 alongside batting strike rate, Dot% for dot-ball percentage, Boundary% for the share of runs from boundaries. None are core; you’ll see them on ESPNcricinfo and some county apps, and can safely ignore them if they’re not familiar.
One that catches Test viewers out: the small “*” next to a partnership total. It means the partnership is currently in progress. A static partnership total without the asterisk is one that’s already broken. The partnership column, when shown, reads as “78 (102b)” — 78 runs scored between the two batters, off 102 balls.
How Scorecards Differ Across Formats
The scorecard architecture I’ve described stays constant across cricket’s four major formats, but the proportions distort beautifully. A Test scorecard and a Hundred scorecard are the same instrument tuned for very different songs. If you want a deeper look at the formats themselves rather than how their scorecards display, the side-by-side breakdown of Test, ODI, T20 and The Hundred goes further.
In Test cricket the scorecard breathes. Days roll over, sessions tick past, and the scorer has space to record granular detail. Minutes batted often appears as a column. Partnerships are tracked with timestamps. The bowling card grows long because every bowler in the line-up will have a substantial set of overs. You’ll see “Anderson 32-9-87-3” — 32 overs, 9 maidens, 87 runs, 3 wickets — and that single row is the spine of an entire day’s work. In 2024 spin overs in the County Championship jumped to 37% of total deliveries, against 17% the year before, and that change is visible on the bowling card before it shows up anywhere else.

An ODI scorecard sits in the middle. Fifty overs per side, ten bowlers maximum, each capped at ten overs. The bowling card therefore has at most five or six rows, and each bowler’s “10-0-54-2” tells you most of what you need. Strike rates among the top order will be in the 80s to 90s during a regulation chase. The extras line tends to swell in ODIs more than in Tests because wides on bouncers and outside leg are policed harder.
T20 compresses everything. Bowling rows show four overs maximum. Batting strike rates start at 100 as the floor of competence and climb past 200 for the death-overs power hitters. The extras line is small in absolute terms but proportionally significant — give away 8 in a 160-run match and you’ve leaked 5% of your defendable total. The top line resets in shape too: instead of “248/7 (62.3)” you get “162/6 (20.0)”, and most chases now sit between 140 and 200.
The Hundred scorecard is the variant that genuinely changes the geometry. The over column is replaced by a balls-remaining counter. Five-ball “sets” replace six-ball overs, and the change-of-ends every ten balls means the bowling card has unfamiliar row arithmetic — bowlers deliver in five-ball or ten-ball blocks, never the four-times-six pattern that anchors T20. Strike rates and economy still calculate to 100 balls and to “per over” respectively, but the framing on the live feed sometimes shifts to runs per ten balls, which is the natural beat of the format.
Women’s cricket uses identical scorecard architecture across all four formats. The 2025 Women’s Hundred final at Lord’s drew 22,542 spectators, and the broadcast scorecard for that final was indistinguishable in structure from any other Hundred fixture. The reason matters: a single literacy unlocks every cricket scorecard you’ll ever see, men’s, women’s, professional, club, in any country that scores cricket. Once you’ve read one, you’ve read them all.
Scorecard Reading Doubts Cleared Up
Written by the editors at Stumply.
