
Cricket Score Now: The UK Guide to Live Scores, Formats, and Coverage
 Available in US
Live UK cricket scores. Every ball, every match, every season.
Why "Cricket Score Now" Means Different Things in the UK
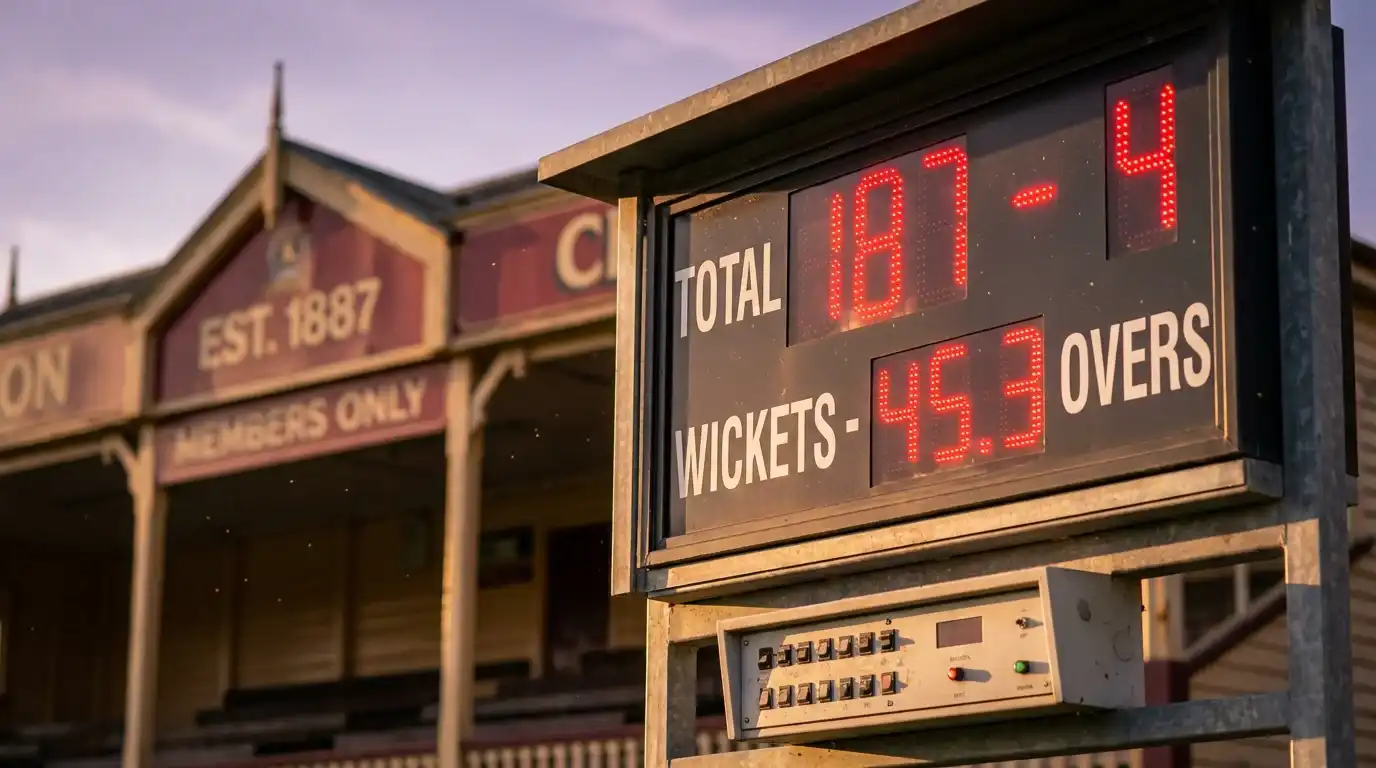
I once watched a Test match at Lord's with three devices open: the broadcast on the big screen, an app showing ball-by-ball updates, and a radio earpiece running text commentary with a delay. None of them agreed on the score. The pavilion board said 247 for 4. My phone said 248 for 4. That tiny three-screen disagreement is what people actually mean when they type "cricket score now" into a search bar — they want one trustworthy number, fast, and they want to know what that number is telling them.
In the UK, "cricket score now" is a more layered query than it looks. You might be chasing a County Championship four-day match drifting through its third session, a women's Hundred fixture compressed into a hundred-ball window, an England Test from Brisbane that started at midnight, or a club Saturday-afternoon match running off Play-Cricket. Each has its own scorecard logic, its own broadcast home, and its own audience. Treating them as the same thing is how viewers get confused about why the run rate keeps changing or where the highlights live tonight.
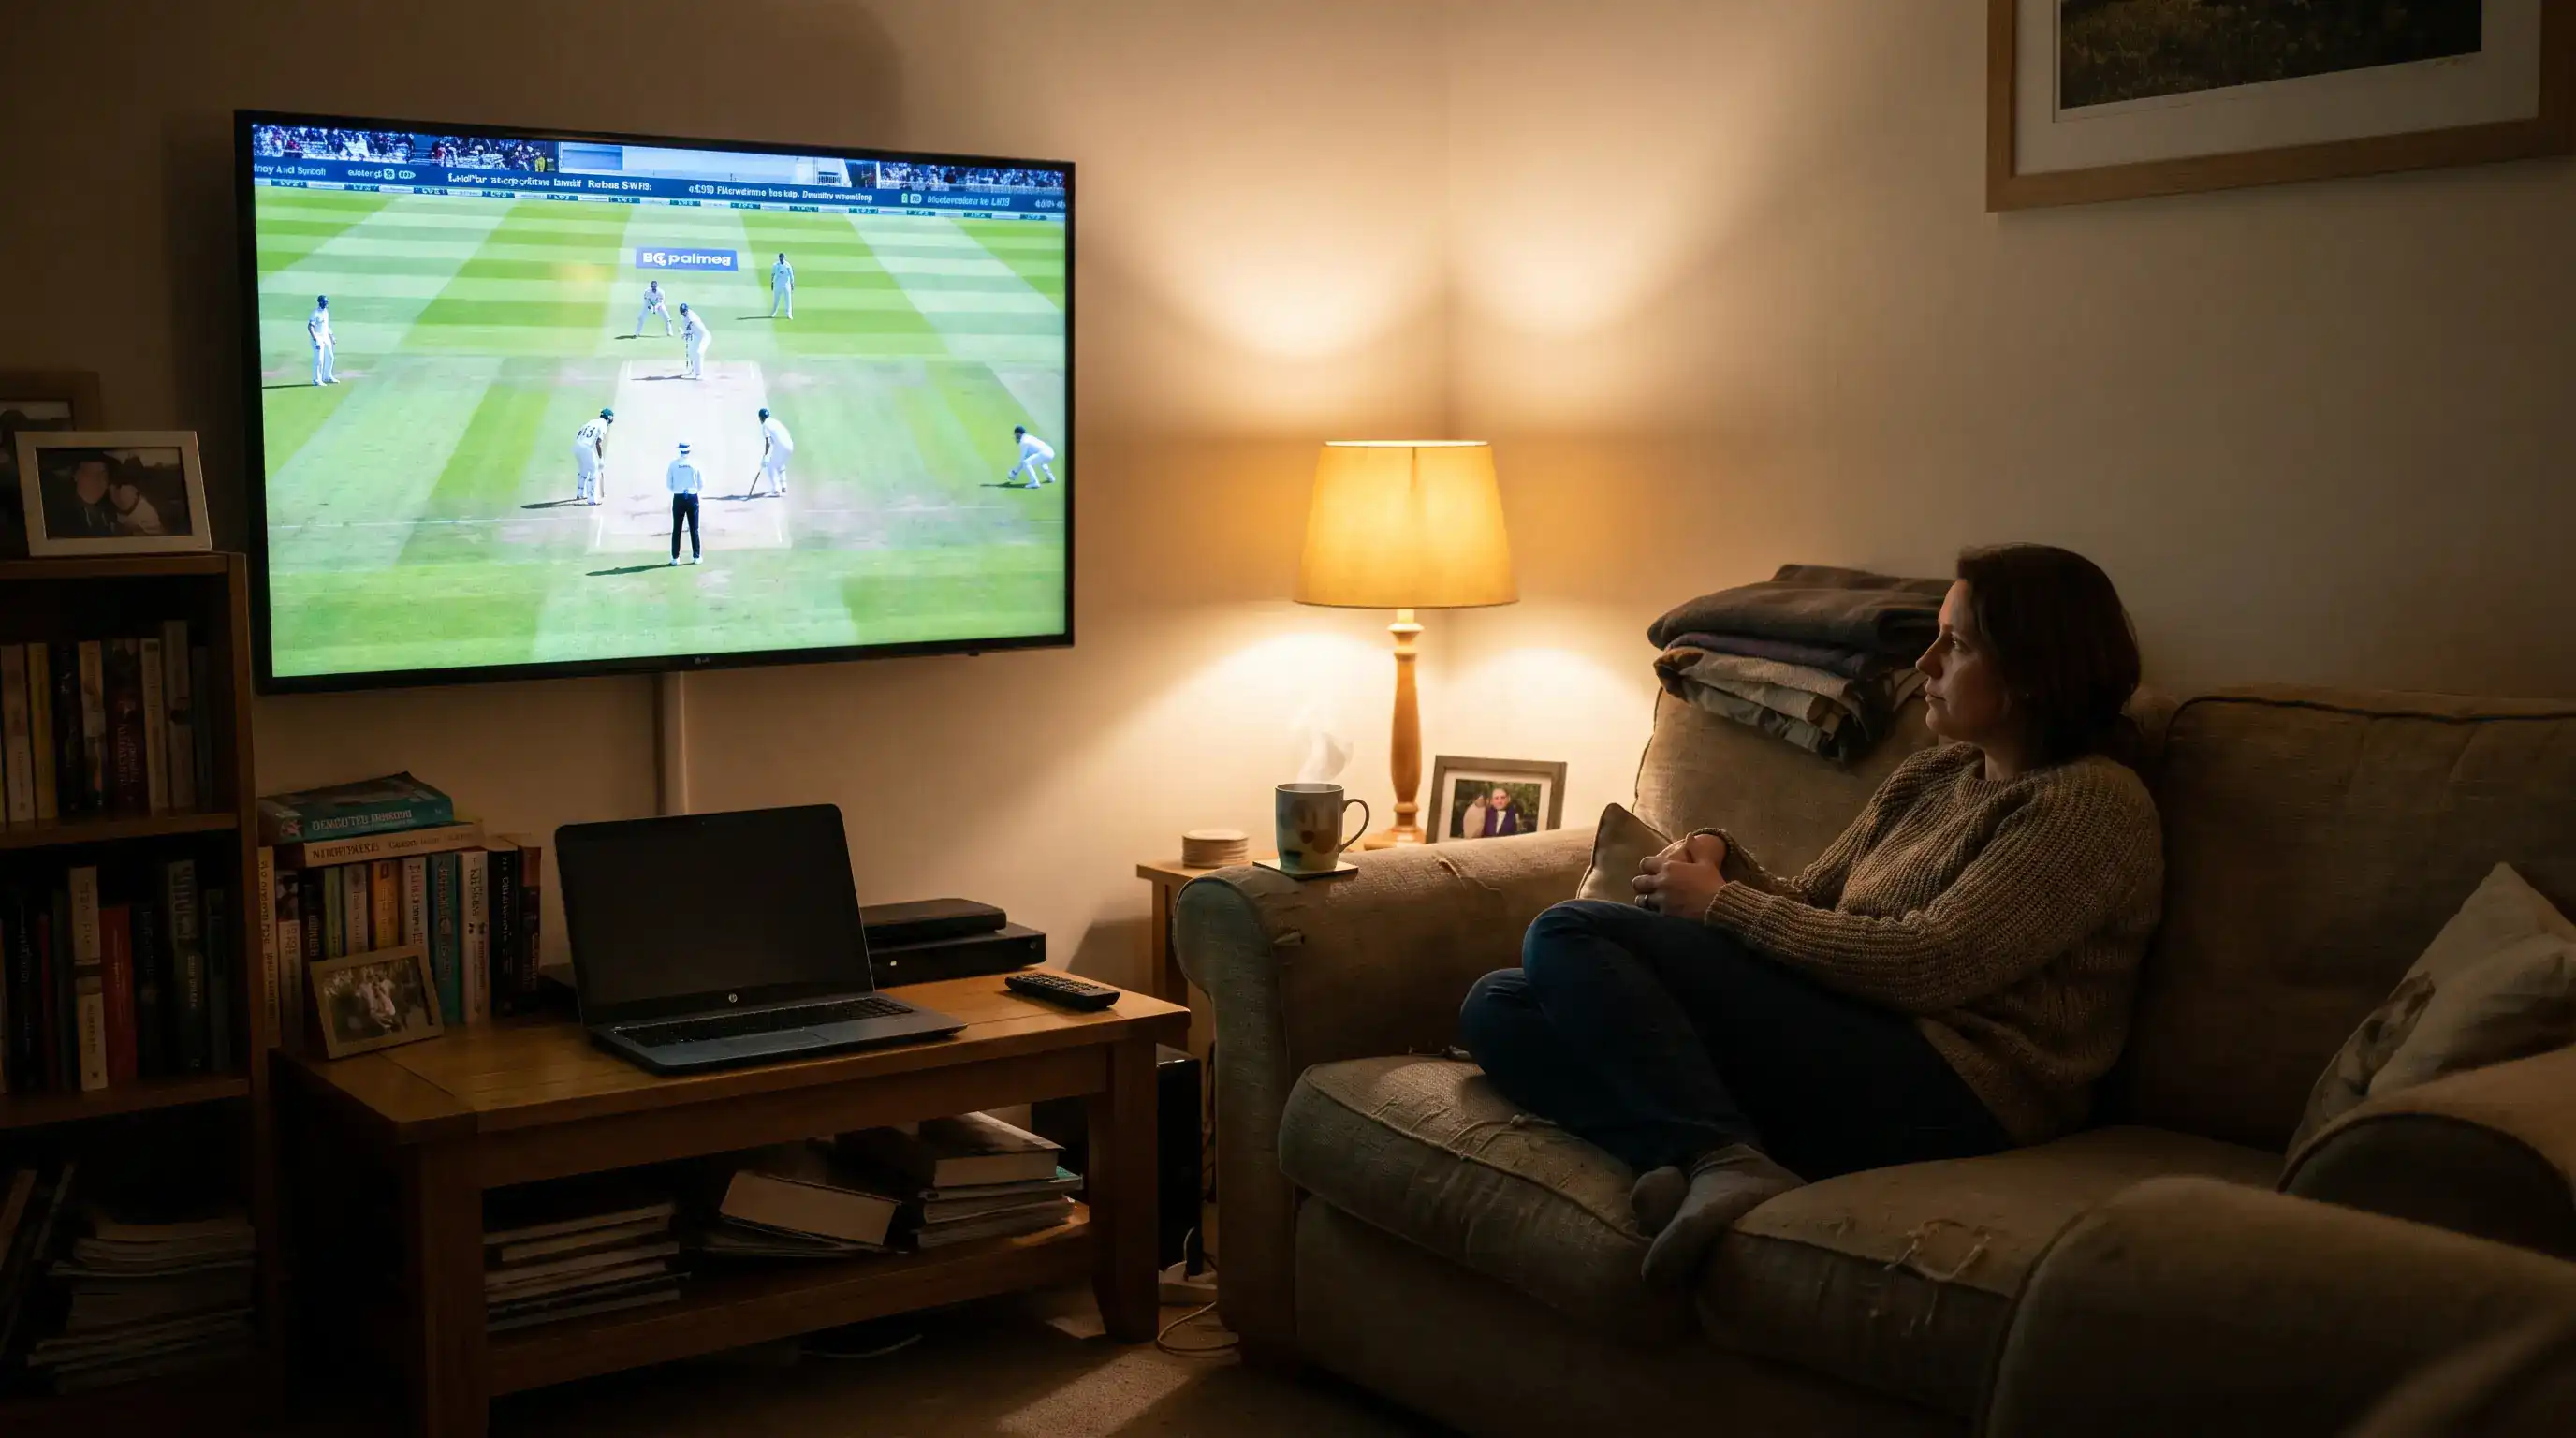
The behavioural backdrop helps explain why this matters. Almost two-thirds of British adults use their phone while watching television, which means a live scoreboard is no longer a competing screen — it's a default companion to whatever is on the box. I wrote this guide for the viewer juggling those screens: somebody who wants the score, but also wants to know which app to trust, which channel carries the game in the UK, what those abbreviations on the card mean, and why the target sometimes mysteriously shrinks during a rain delay. After nine years tracking UK match-day patterns, I can tell you the same handful of friction points trip people up every season.
The rest of this guide treats those friction points one at a time, in the order they tend to hit a viewer through an afternoon of cricket.
The Whole Guide in Ninety Seconds
- A live cricket score is a layered object: total/wickets/overs up top, batter and bowler cards below, ball-by-ball events feeding both.
- UK coverage splits across Sky Sports (the lion's share), the BBC (free-to-air highlights and some Hundred matches), TNT Sports for some overseas tours, and BBC radio for ball-by-ball audio.
- Test, ODI, T20 and The Hundred have different scoring rhythms — knowing which format you're watching is half of reading the scoreboard.
- DRS, DLS and Hawk-Eye explain most of the "why did the score just do that" moments.
- The Hundred crossed 580,000 tickets in 2025 and 2.5 million cumulative attendance — the format is reshaping who watches cricket here.
What a Live Cricket Score Actually Shows You
The first time a colleague asked me, in a press box, "but what does 312 for 6 actually mean," I realised cricket has a notation problem. Football has one number on each side. Tennis has games and sets, but you can read them at a glance. Cricket builds its live score out of at least four moving parts at once.
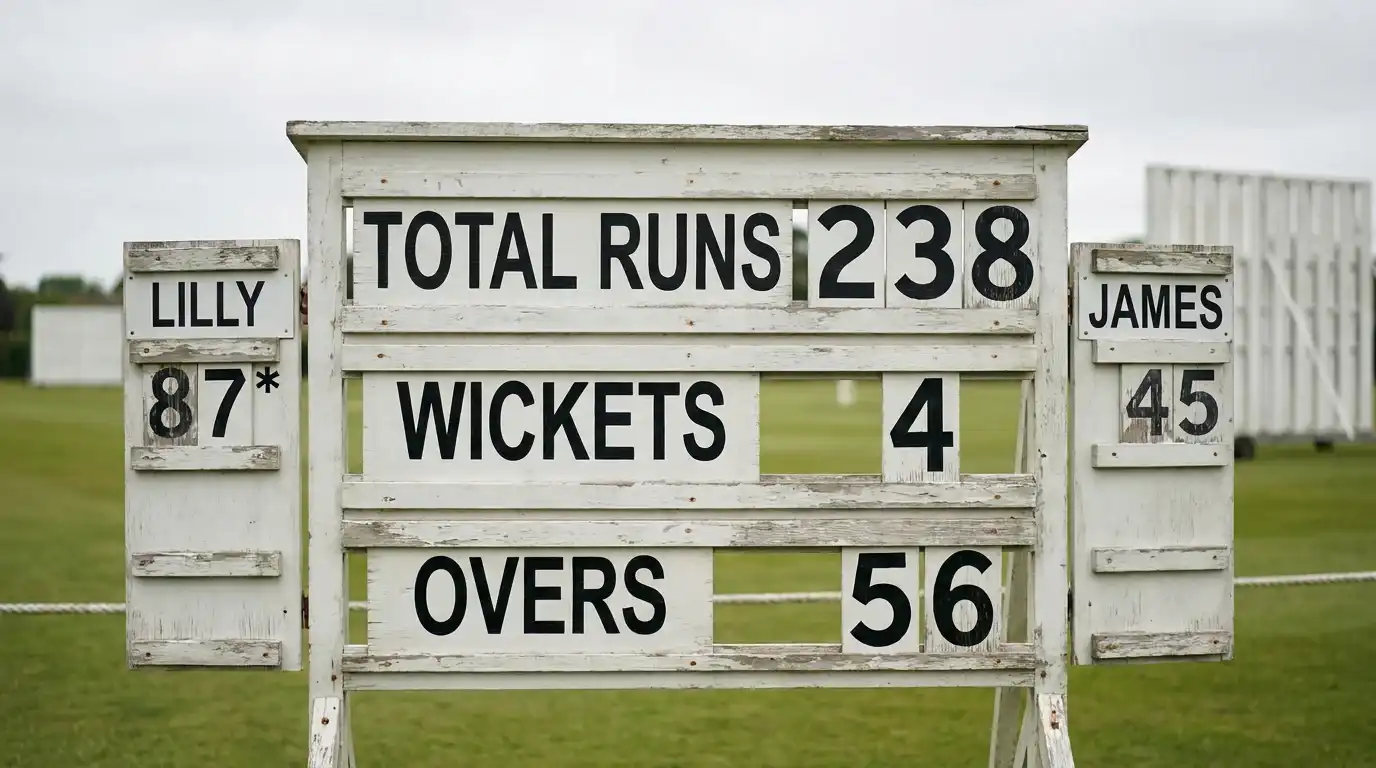
Strip away the noise and a live cricket scoreboard is doing four jobs simultaneously. It tells you the team's running total. It tells you how many wickets are down. It tells you how many overs (or balls, in The Hundred) have been bowled. And it tells you which two batters are currently at the crease and what each has scored. Everything else — the run rate, the required run rate, the partnership, the manhattan graph at the bottom of the page — is derived from those four primary inputs.
The four core inputs
Runs scored, wickets fallen, overs bowled, batters present.
The derived metrics
Run rate, required run rate, partnership total, projected score.
The annotations
Declarations (d), all out (ao), follow-on (f/o), DLS par, super over markers.
The shorthand is where most newcomers get lost. A line that reads England 312 for 6 d (98 overs) packs an enormous amount of information into eleven characters. England scored 312 runs. They lost 6 wickets in doing so. The captain declared the innings closed — that's what the "d" stands for — even though four batters were still available, presumably because he wanted a crack at the opposition before stumps. Ninety-eight overs were bowled to reach that point. From that one line, a seasoned watcher already knows roughly how the day went.
How a typical scoreboard line breaks down
Australia 247 for 4 (62.3 overs, RR 3.95)
247 runs scored. Four wickets down, six in hand. Sixty-two complete overs plus three deliveries of the sixty-third. Run rate of 3.95 per over — modest, consistent with a Test-match accumulation pace.
Then there are the bracket-after-bracket items that arrive once the technology layer kicks in. DRS used to settle decisions, which the broadcast feeds will flag on the live ticker. DLS revised targets, which appear when rain has interrupted a limited-overs game. And the ball-by-ball log running beneath, which is where the score is actually constructed delivery by delivery before it ever reaches the top line. DRS is invoked in roughly 15% of all wickets in Test matches, which means the live ticker is doing more work than it looks during a long day in the field.
RR — Run Rate, calculated as runs scored divided by overs bowled. A Test innings ticking along at 3.5 looks healthy; a T20 innings stuck at 6.0 is in trouble.
RRR — Required Run Rate. The runs per over the batting side needs from here to win, given the balls remaining and the target.
What a live score does not show you, by default, is context. It will tell you the run rate is 7.2 but not that the pitch has slowed and a run rate of 7.2 in the last six overs would be miraculous rather than routine. That's the gap broadcast commentary tries to fill, and that the better apps now fill with worm charts and over-by-over graphics. The number is a starting point, not an answer.
Where to Watch Live Cricket Scores in the UK
Ask any UK cricket fan over forty how the broadcasting landscape works and watch them sigh. The honest answer is that following live cricket here used to be a single-channel question and is now an exercise in stacking subscriptions, free-to-air windows, radio frequencies and apps. None of it is impossible. All of it benefits from a map.
The financial centre of gravity sits at Sky. The pay-TV broadcaster has been the senior partner in English cricket since 1999 and is the engine that funds most of what the English and Welsh game does. Sky has invested £1.4 billion in cricket rights since 2000, and the current ECB deal — running through 2028 — sees domestic rights income climbing from £37.8 million in 2025 to £54.3 million per year through 2028. Around three-quarters of ECB's roughly £310 million annual revenue comes from broadcast rights, with Sky the dominant counterpart.
That commercial reality maps onto what's available where. Live coverage of England men's home Tests, most County Championship, T20 Blast and most Hundred sits behind the Sky paywall. The BBC carries free-to-air highlights, selected Hundred matches, women's internationals and a strong online text-commentary product. Test Match Special on BBC Radio remains the radio benchmark. TNT Sports takes some overseas touring rights.
| Source | Primary role | What's there | Cost model |
|---|---|---|---|
| Sky Sports Cricket | Lead pay-TV broadcaster | England home internationals, County Championship, T20 Blast, most Hundred | Subscription |
| BBC Sport | Free-to-air partner | Hundred selected matches, women's internationals, highlights, live text | Licence fee |
| BBC Radio (TMS) | Long-form audio | England matches ball-by-ball, county updates | Licence fee |
| TNT Sports | Variable overseas rights | Selected overseas tours when on the rights cycle | Subscription |
| ECB Match Centre | First-party data | Live scorecards, county streams via supporter accounts | Free / some paid |
| Flashscore, ESPNcricinfo, Cricbuzz | Independent scoreboards | Ball-by-ball across all formats globally | Free, ad-supported |
One practical wrinkle that catches new viewers out: the highest-profile UK women's matches and selected men's Hundred fixtures appear on BBC and Sky simultaneously. That dual-broadcast model is rare in UK sport. It means a viewer without a Sky subscription can still see live cricket on a free channel for a meaningful chunk of the summer, which has shifted how families plan their match days.
For the actual scores rather than the pictures, the choice is wider and mostly free. The ECB's own Match Centre is the cleanest source for county and domestic content. ESPNcricinfo and Cricbuzz handle international and franchise cricket exhaustively. Flashscore is the catch-all that picks up almost everything. We get into the differences between these in a moment, but the headline is that you don't need a paid subscription to watch numbers move — only to watch the broadcast that surrounds them.
If you want the deeper picture of how rights deals shape what reaches UK screens, the UK cricket broadcasting landscape guide unpacks the history and the streaming layer in detail.
Reading a Cricket Scorecard: A Quick Tour
My father-in-law, who has watched cricket for sixty years, still calls a scorecard "the puzzle." Cricket's scoring notation evolved across a century and a half, and every era added an abbreviation rather than tidying up the previous one. The result looks unfriendly to a newcomer and entirely natural to anyone who's been at it for a while.
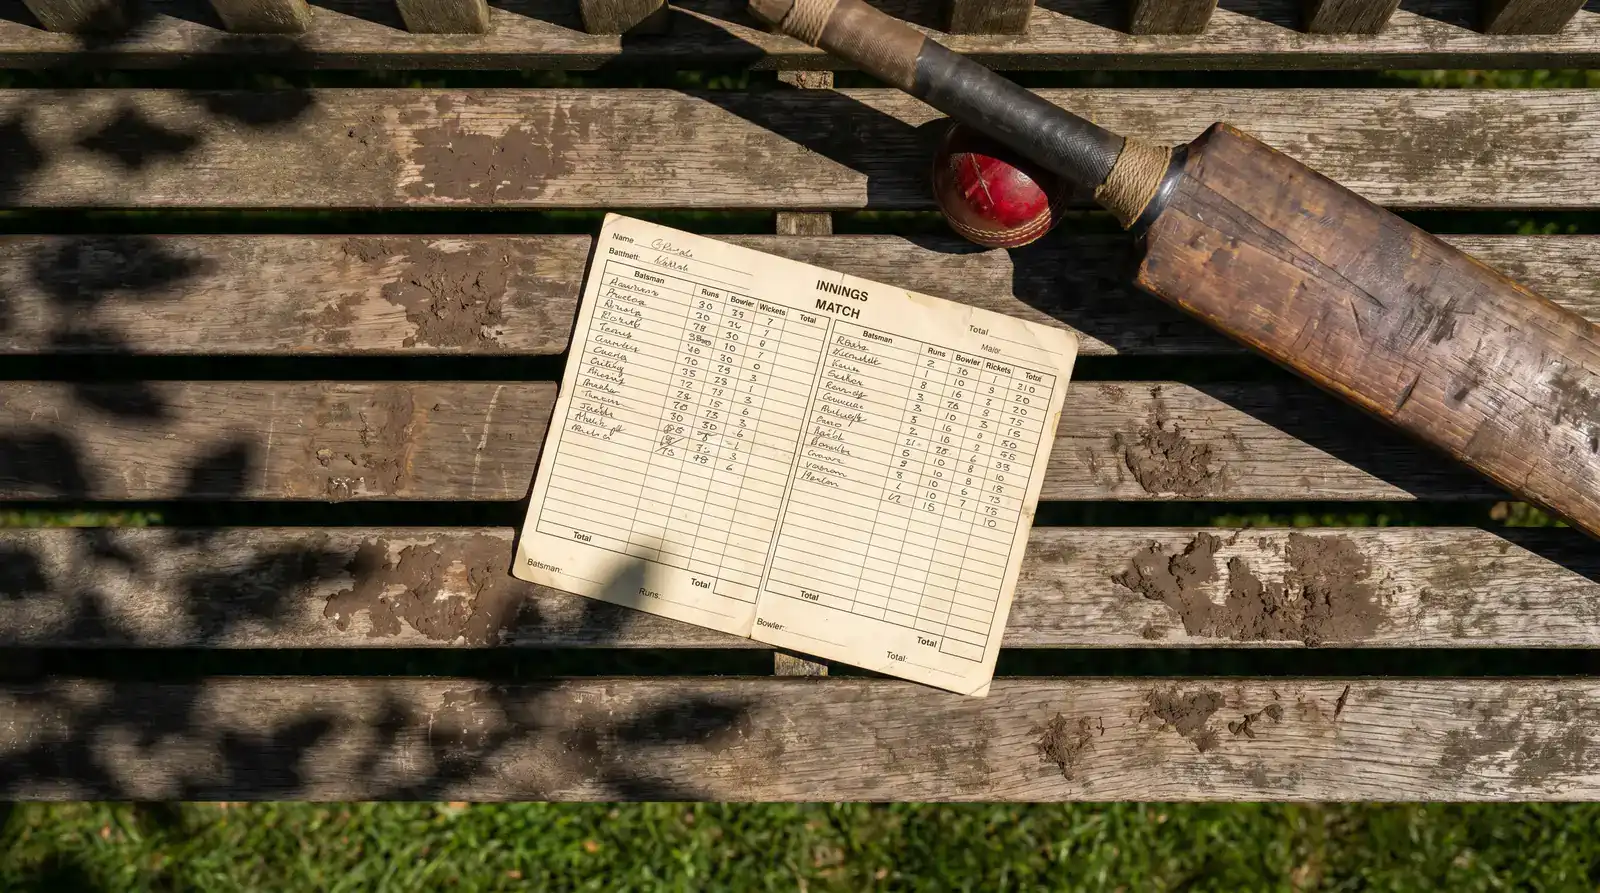
Start at the top, then read down. The top line is the team total: runs scored, wickets fallen, overs bowled. Below that sits the batting card — a row per batter, who's out, who's not out, balls faced, fours, sixes. Below that, the bowling card — overs delivered, maidens, runs conceded, wickets taken. Then fall of wicket, telling you the score at each dismissal. Then extras. Then partnership records. The card is built like a stack, top-down, and you can read it as deeply as you need.
A worked batting row
J. Root c Smith b Cummins 64 (118)
Joe Root, caught by Smith, bowled by Cummins, scored 64 from 118 balls. The "c" tells you the mode of dismissal, the first name after it is the fielder, "b" indicates the bowler. Strike rate sits implicit in the two numbers — 64 from 118 works out at 54.2, normal Test pace.
The single most useful habit for new viewers: when a wicket falls, glance immediately at the fall-of-wicket line. It will read something like 4-247 (Root, 78.4), telling you the fourth wicket fell with the total on 247, the batter dismissed was Root, and it happened on the fourth ball of the seventy-ninth over. That single line tells you what the partnership added and how long the batting side held on.
The bowling card is the mirror image. A line that reads Cummins 24-7-58-3 tells you Cummins delivered 24 overs, of which 7 were maidens (no runs scored), conceded 58 runs and took 3 wickets. Economy rate (runs per over) is implicit at 2.42 — restrictive Test bowling. In a T20 the same notation appears, but a "good" economy is a completely different number: anything under 7.00 in T20 is solid, anything over 9.00 starts to look expensive.
Maiden over — a six-ball over in which no runs are scored off the bat (byes and leg-byes don't count against it). In T20 cricket a maiden is treasure; in Test cricket it's part of the rhythm.
Extras deserve a paragraph of their own because they trip people up. wd is a wide — a ball too far from the batter to be hit, conceded as an extra run and an extra delivery. nb is a no-ball, same penalty plus a free hit in white-ball cricket. b is a bye, runs taken without the bat making contact, and lb is a leg-bye, runs taken off the body when the batter offered a shot. The team total includes all of these; the individual batter's score doesn't.
That's the working vocabulary. Everything else on a card — strike rate, economy, partnership totals, run rate, projected score — is just arithmetic running over those base inputs. If you want the deeper field guide, our how to read a cricket scorecard walkthrough takes each block of the card in turn with worked examples.
Test, ODI, T20, The Hundred: What Changes the Score
Here's a question I ask anyone new to cricket who's trying to understand why their friend's eyes lit up at 247 for 4 when they thought that sounded fine: which format are we watching? The answer changes everything. A score of 247 for 4 after sixty overs is a Test team grinding through a session. The same 247 for 4 after twenty overs would be a T20 batting performance for the ages. Cricket runs four formats simultaneously, and each one treats runs, overs and risk on a completely different scale.
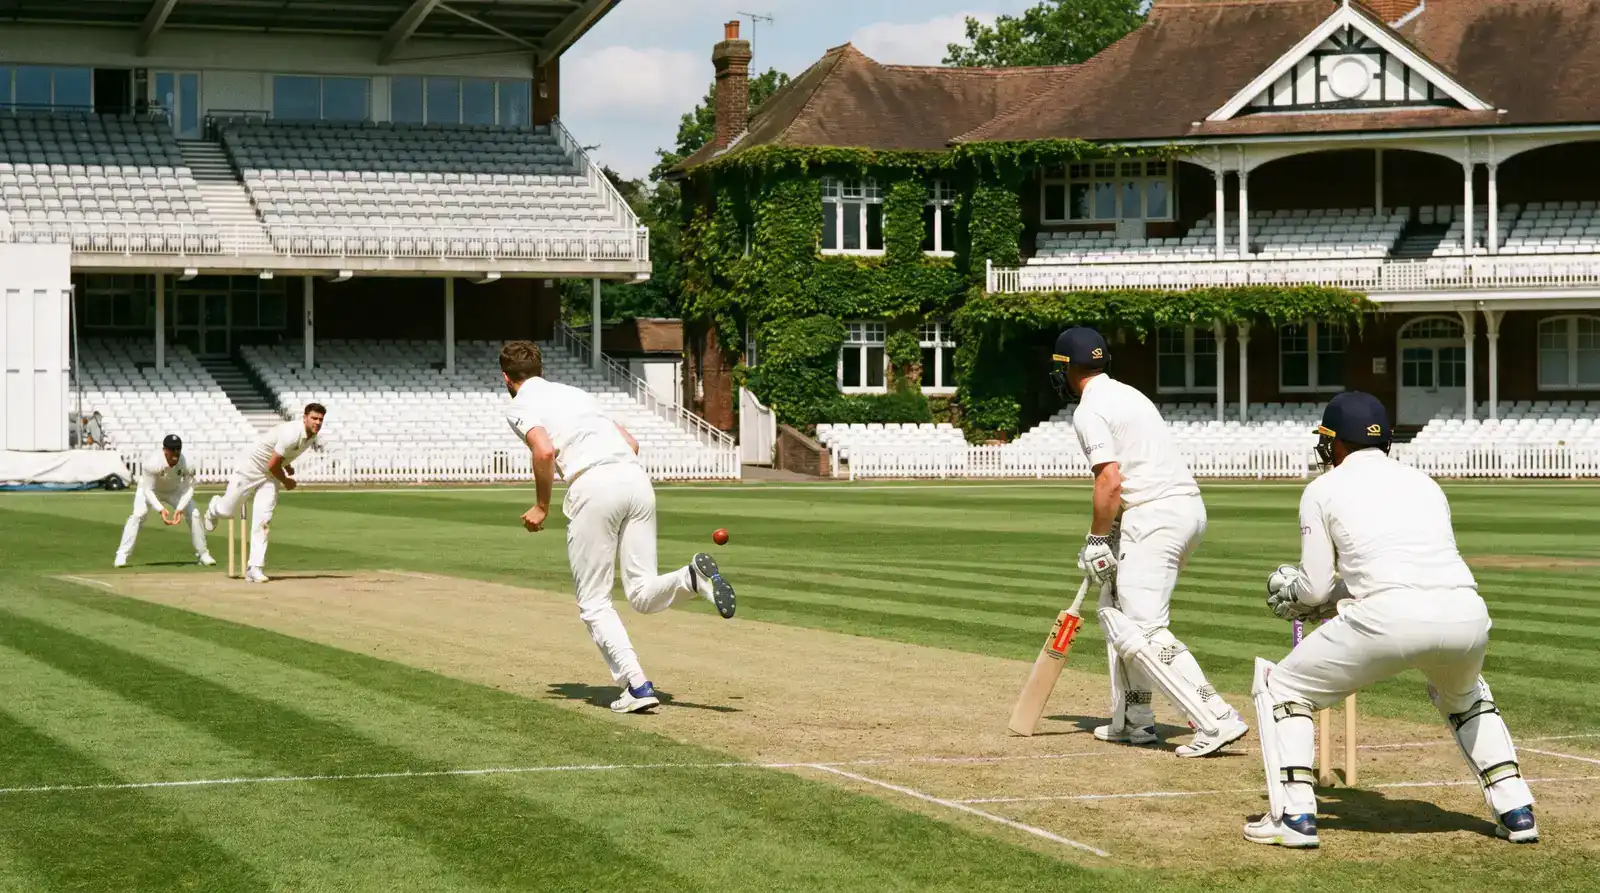
Test cricket is the longest form: up to five days, two innings per side, no over limit. Each delivery is part of a much larger negotiation between batter and bowler, and a "good" individual score is anywhere from 50 to a double-hundred depending on conditions. One-Day Internationals (ODIs) are 50 overs per side, one innings each, so the batting team has 300 balls to set or chase a total. T20s compress that to 20 overs — 120 balls — and reward power-hitting. The Hundred is even tighter at 100 balls per innings, with structural quirks I'll come back to in a moment.
| Format | Length | Balls per innings | Typical winning score | Powerplay rules |
|---|---|---|---|---|
| Test | Up to 5 days | No limit | 350–500 in first innings | None |
| ODI | One day | 300 (50 overs) | 270–320 | Three phases: 10/40/10 overs |
| T20 | ~3 hours | 120 (20 overs) | 160–200 | First 6 overs |
| The Hundred | ~2.5 hours | 100 balls | 150–180 | First 25 balls |
The Hundred is the format with the most architectural quirks. Bowlers deliver in five-ball sets rather than six-ball overs. A bowler can deliver two sets back-to-back from the same end before swapping. Ends change every ten balls regardless. Each bowler is capped at 20 balls total. It's not a gimmick — every change is engineered to keep the game tight and the run rate volatile. The Hundred passed 580,000 tickets sold in 2025 and over five seasons has accumulated more than 2.5 million in attendance, so the format is doing something right with UK audiences.
The 2024 County Championship saw a quiet revolution in bowling balance: spinners delivered 1,035.4 overs across the season, accounting for 37% of all overs bowled — up from 17% the year before. Run rates in spin-dominated sessions dropped sharply, and several matches reached results that wouldn't have happened in a quicker-paced era.
Domestically, the four formats sit in a layered calendar. The County Championship runs the red-ball four-day game across two divisions — the 2025 season was the 125th edition, 18 teams playing 126 matches, with Nottinghamshire taking a seventh title. The T20 Blast runs in midsummer, with Somerset crowned 2025 champions over Hampshire in the final. The Metro Bank One-Day Cup occupies a 50-over slot. The Hundred sits in a compressed August block. Each format produces a different scoreboard rhythm: gentle accumulation in Tests, building urgency in ODIs, near-constant aggression in T20 and The Hundred.
What this means for live-score watching is that the same numbers carry completely different weight. A score of 8 for 2 after 3 overs in a T20 is a disaster. The same 8 for 2 after 3 overs in a Test is normal early-morning attrition. The format isn't context — it's the entire grammar. For a fuller comparison of how each format reshapes scoring and tactics, see cricket formats compared.
DRS, DLS and Hawk-Eye in Plain English
An umpire I spoke to at a county ground once told me, half-joking, that the worst thing about modern cricket isn't the technology — it's that everybody now expects technology in matches where there isn't any. He had a point. The acronyms DRS, DLS, Hawk-Eye and UltraEdge dominate broadcast coverage, but they only exist in the top tier of the sport. At grassroots and most county levels, decisions are made the old way. Knowing which is which helps a viewer interpret what the scoreboard is doing.
DRS
Decision Review System — the umpire-review process. Teams can challenge an on-field decision.
DLS
Duckworth-Lewis-Stern method — recalculates a target when rain disrupts a limited-overs match.
Hawk-Eye
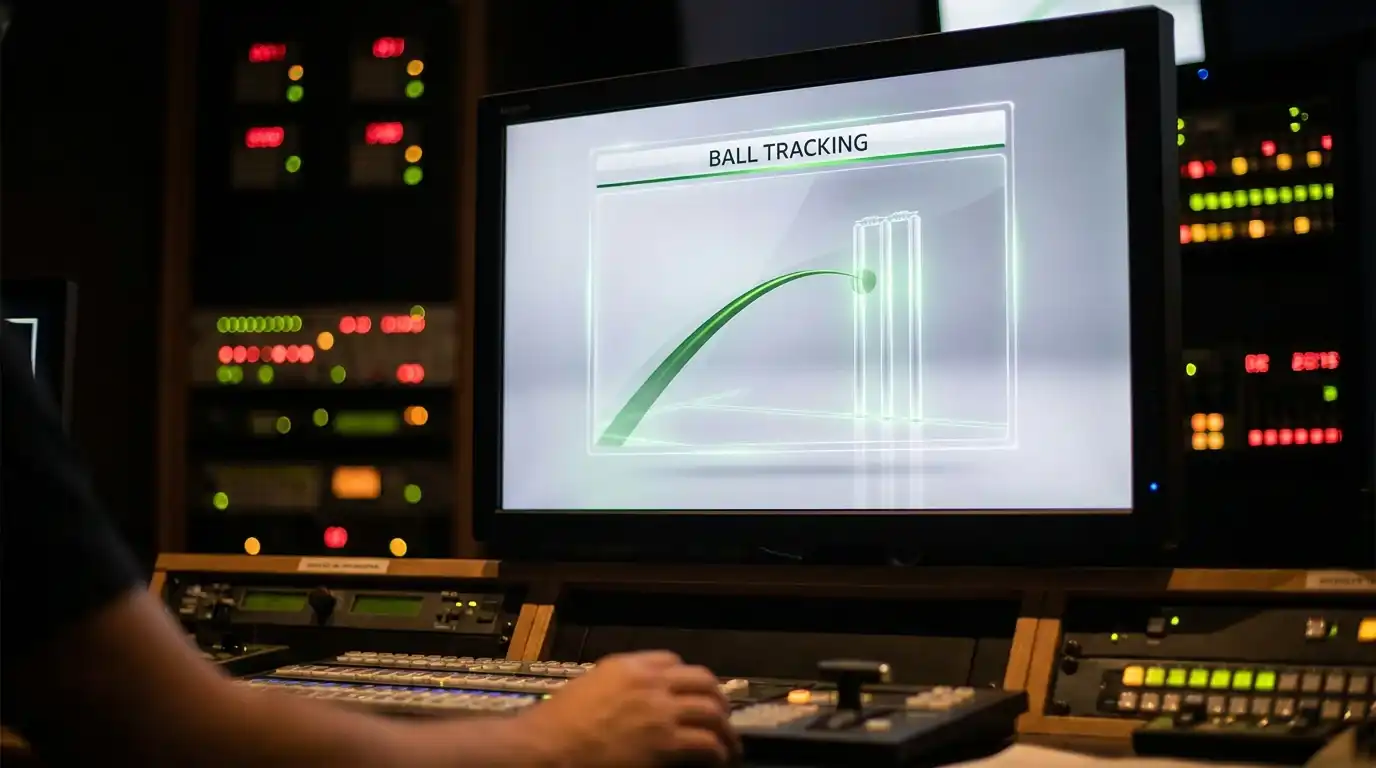
Ball-tracking camera system that maps the trajectory of every delivery.
UltraEdge
Audio-visual edge detection — synchronises stump-mic sound with broadcast frames.
DRS is the most visible because it changes outcomes on the field. When a batter or fielding captain disagrees with an on-field decision, they signal a "T" with their arms and the third umpire reviews the call using ball-tracking, edge detection and replay angles. DRS has lifted the accuracy of on-field decisions from about 93% to over 98%. After ICC tightened the wicket-zone rule in 2021 — extending it to the top of the bails — the baseline overturn rate for non-umpire's-call LBW decisions climbed from 22% to 27%.
The wrinkle most fans don't notice: DRS is used in roughly 15% of all wickets taken in Test matches. Three-quarters of wickets you see on a Test scoreboard are clean — no review, no third-umpire intervention. The drama of a tense review tends to dominate highlights packages and skews the impression of how often technology is actually involved.
Hawk-Eye is the engine inside many of those reviews. A bank of cameras around the ground tracks the ball at high frame rate, and software stitches them into a 3D path. Manufacturers report a first-contact accuracy of around ±5 millimetres and a predictive trajectory uncertainty of about ±2 millimetres. Those numbers matter when an LBW review comes down to whether the ball was clipping the off bail. They're also why "umpire's call" exists — when the predicted impact straddles the wicket zone by less than the system's margin of error, the on-field decision stands.
DLS is a different animal entirely. It's not about adjudicating moments; it's about preserving the integrity of a chase when weather chops the match in half. The method treats each team's innings as a budget of "resources" — the combination of overs and wickets available. If rain costs Side B twenty overs, the algorithm recalculates a target that reflects the resources they actually have, rather than the ones they were originally given. It's mathematically dense, but the upshot on a live scoreboard is simple: the target moves, often by an awkward amount, and the broadcast flashes "DLS Method" next to the new number.
Umpire's call — In LBW reviews, when the ball-tracking shows marginal contact with the wicket zone, the on-field decision is upheld regardless of which way the third umpire would have called it independently. It's the cricket equivalent of "the camera's not sure either."
If you find yourself frequently staring at a scoreboard saying things like "DLS par 184" or "target revised to 167 from 38 overs," the full mechanics of those moments belong in our cricket officiating technology guide. For now, the takeaway is that the numbers you see on a live screen are increasingly the output of algorithms, not just the result of two umpires and a scorer adding up the day.
Stumply Resource Model · SRM‑26
The Rain Ladder
Covers on. Is the chasing side ahead or behind — and what would the revised target be? Set the match state and read the ladder: it shows the par score at the end of every remaining over.
Revised target
191 runs
from 38 overs · a tie needs 190
Batting first: 100.0% of an innings. Chasing: 76.7%.
Level.
Par score now
124
Score that ties the match if it ends here
Required rate
4.71
72 runs from 15.2 overs
Cost of the next wicket
+6
A wicket takes nothing off the board — it raises the par score you are measured against by this much
The ladder
The score the chasing side must be on at the end of each over to be level, at 3 wickets down. Green rungs are the ones they are already clear of.
behind them current over still to come
The resource table this runs on
Every number above comes from one idea: an innings is a budget of resources, and resources are overs and wickets together. The table reads as a percentage of a full innings in this format.
| Overs left | 0 wkt | 1 | 2 | 3 | 4 | 5 | 6 | 7 | 8 | 9 |
|---|
On narrow screens the odd-numbered wicket columns are hidden to keep the grid readable.
The Stumply Resource Model is our own approximation of how overs and wickets trade off, built to explain what a revised target is doing. It is not the official Duckworth‑Lewis‑Stern calculation and must not be used to settle a real match — only the ICC-licensed DLS software does that. Expect a few runs of difference on a typical interruption, and more in the deep tail (nine down, a handful of overs left). The Hundred is modelled by converting balls to overs; the competition uses a bespoke table of its own.
The UK Cricket Season at a Glance
Tell a non-cricket person that the English summer runs from April to late September and they'll nod politely. Tell them it contains four competing professional competitions for the same eighteen counties plus an international schedule, and they start to look concerned. The UK cricket season is a Tetris puzzle, and once you can see the shape of it, the calendar of live scores you'll be tracking becomes much easier to anticipate.
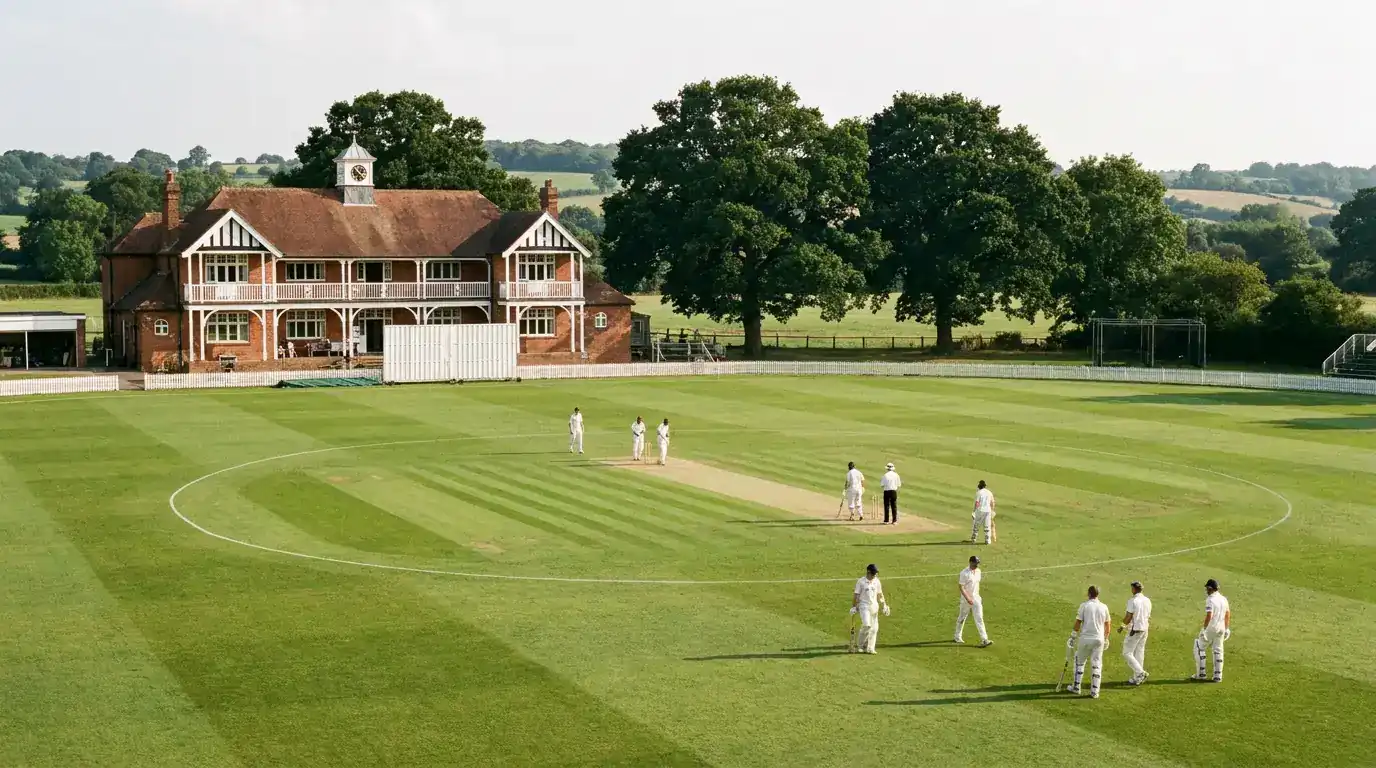
The season opens in mid-April with the County Championship — red-ball, four-day, two divisions, the most traditional format. It bowls itself into mid-summer, takes a substantial pause, and resumes in September for the run-in. The Metro Bank One-Day Cup occupies a July-August window — 50 overs, often with weakened county squads because senior players have been claimed by The Hundred. The T20 Blast group stage runs through May and June, with quarter-finals in late summer and Finals Day in September. The Hundred sits in a tight August block and dominates the headlines for those three weeks.
| Window | Competition | Format | Frequency |
|---|---|---|---|
| April – early July | County Championship (block 1) | Red-ball 4-day | Roughly weekly |
| May – July | T20 Blast (group stage) | 20-over | Several per week |
| June – August | England men's home internationals | Tests, ODIs, T20Is | Series blocks |
| July – August | One-Day Cup | 50-over | Group stage |
| August | The Hundred (men's and women's) | 100-ball | Daily through 3-week block |
| September | County Championship (block 2) | Red-ball 4-day | Roughly weekly |
| September | T20 Blast Finals Day | 20-over knockout | One day, three matches |
The international layer sits on top of all that. England men typically host two Test series each summer — one in June against a touring side, one running through July and August against the headline opposition. White-ball series (ODIs and T20Is) plug into gaps before, between and after the Tests. England women's home international schedule follows a similar pattern, often opening earlier in the summer and overlapping with the men's calendar.
The UK season produces a remarkable annual attendance figure. The ECB recorded 2.84 million spectators in 2024 — the best ever for a non-Ashes, non-India year. Multiply that by the live-score traffic those matches generate online and you start to see why every major data provider competes hard for UK cricket fans.
What this calendar means for the live-score watcher is that between April and September, there is almost always something to follow — often two or three things at once. A Saturday in mid-August might offer a Hundred double-header, a Test match Day Two in Manchester, and the closing stages of a One-Day Cup quarter-final. The skill is choosing what to track and accepting that the secondary game will get the back-of-screen treatment. For the full beat-by-beat calendar mapping each window of the summer to its competition, our UK domestic cricket season calendar page lays the whole thing out.
The Second-Screen Habit Around UK Cricket
The cricket fan I most recognise in 2026 isn't watching one screen — they're watching three. The TV is on for the broadcast. The phone is in one hand running a scorecard app. A laptop somewhere is open to a text commentary or a Slack channel where friends react in real time. This isn't fringe behaviour. Ofcom's Online Nation 2025 report found that almost two-thirds of British adults use their phone while watching television. Cricket's structural shape — long broadcast windows, repeated tactical pauses — makes it ideal terrain for second-screen behaviour.
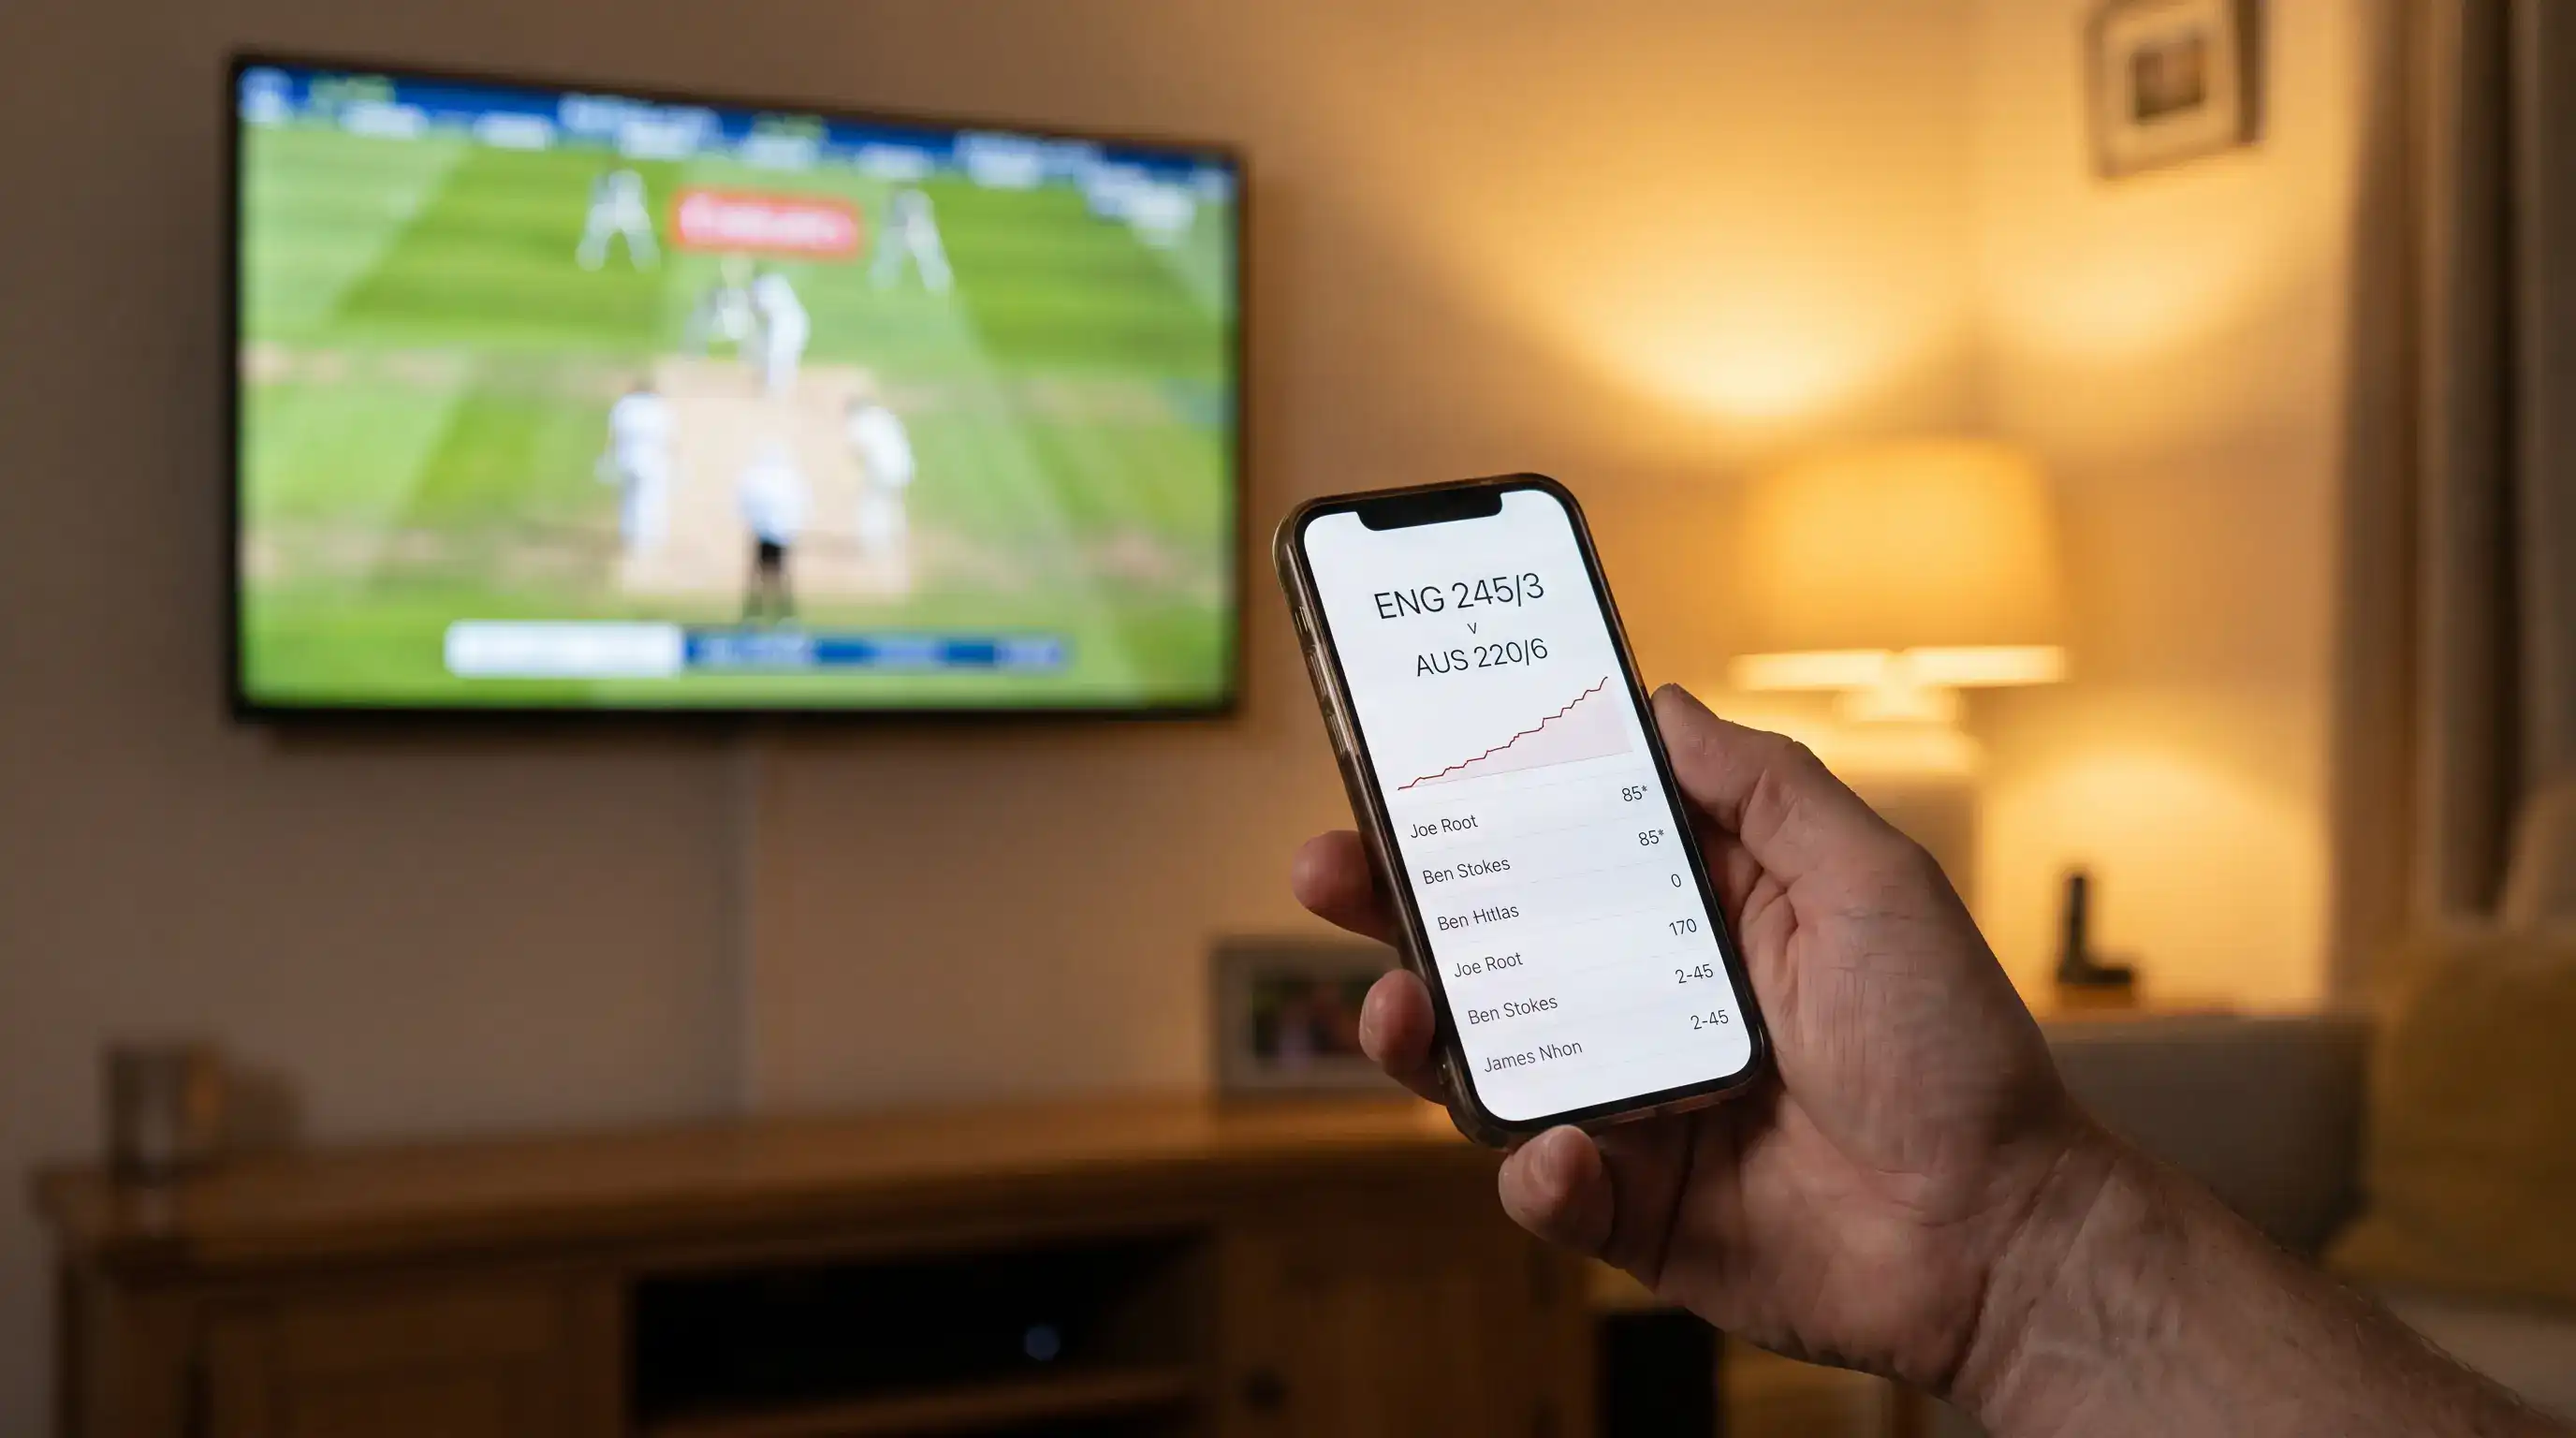
The scale of cricket's app ecosystem is bigger than UK viewers tend to realise. Cricbuzz's Android app has crossed 100 million downloads. ESPNcricinfo's reached around 24 million. Cricbuzz alone pulls in roughly 398 million website visits per month worldwide. During an India-Pakistan match, ESPNcricinfo recorded 17,000 simultaneous users on one match alone; Cricbuzz registered nearly 1,900. UK fans dipping into the same feeds during an England Test sit somewhere on that range.
The practical pitfall of second-screen viewing is latency. Your scorecard app updates faster than your TV broadcast, because the broadcast carries a delay for production and compliance. A wicket sometimes appears on your phone before the bowler has finished celebrating on screen. The unfussy solution is to mute phone notifications during live cricket and accept the broadcast tempo. The alternative is a constant feeling of being spoiled by your own technology.
For the cricket-curious viewer working out a personal stack, the question is less "which app is best" and more "what role am I asking the phone to play?" If it's deeper stats during a broadcast, ESPNcricinfo or Cricbuzz comfortably do the job. If it's a glanceable score while cooking dinner, Flashscore or BBC Sport are quicker. If you want a county-specific match that broadcasters won't carry, ECB's Match Centre is the cleanest option. None of these is the wrong choice; they're tools for different jobs.
Who Is Watching Cricket in the UK Now
"Cricket is for old people" is the assumption I hear from non-fans every season. It's half right and half spectacularly out of date. The UK cricket audience is older than most British sports audiences — that part is true — but it's also rapidly reshaping itself at the edges, and the live-score traffic patterns reflect that more honestly than ticket sales do.

The headline number from Nielsen's UK fan-insights work is that 25.5% of British adults describe themselves as interested or very interested in cricket. That's a higher base than people often assume — a quarter of the country has at least latent engagement with the sport. Inside that quarter, though, the demographics skew significantly. Over 40% of UK cricket fans are aged 65 or above, according to YouGov's UK profiles, which has been the dominant pattern for two decades.
The Hundred has cracked that pattern in a way no other recent UK cricket competition has managed. 31% of The Hundred's fanbase is aged 18 to 44, compared with 24% of the general UK cricket fanbase. That seven-point shift toward younger viewers isn't huge in absolute terms, but it's the kind of audience reshape that broadcasters and sponsors have been chasing for fifteen years.
Income breaks down in a similarly clear way. 30% of Britons earning over £100,000 a year describe themselves as cricket fans, against 20% of those earning under £20,000. Cricket is, in audience terms, distinctly skewed toward higher-income demographics — partly a hangover from the pay-TV era, partly a reflection of who has the leisure time to follow a five-day game. That income skew matters because it influences who advertisers chase, which influences which matches get prime broadcast windows, which influences which scoreboards UK fans see most often.
Women's cricket sits inside its own growth story and deserves its own paragraph. Attendance at the 2023 England Women's Ashes was 288% higher than the 2019 series. The men's 2023 Ashes pulled TV audiences 44% higher than the 2019 equivalent. Both numbers say the same thing: cricket's audience, despite the demographic skew, is growing on its own terms. The growth is uneven — some formats benefit far more than others — but it isn't flat or in decline.
The strategic upshot for anyone watching the live-score ecosystem: cricket's audience is splitting into two visible cohorts. An older, format-loyal Test-and-county audience that prefers radio and the broadsheet text feeds. A younger, format-curious Hundred-and-T20 audience that arrives via Instagram clips and a phone scorecard. Live-score products built for one are increasingly less suited to the other.
Why Grassroots Numbers Matter to the Score You See
It might seem odd to talk about Saturday-league scorecards in a guide that opened with Lord's. They're connected by more than romance. The grassroots base of UK cricket is the supply chain for everything you see on Sky. When the supply chain has problems, the live scores at the top eventually develop problems too.
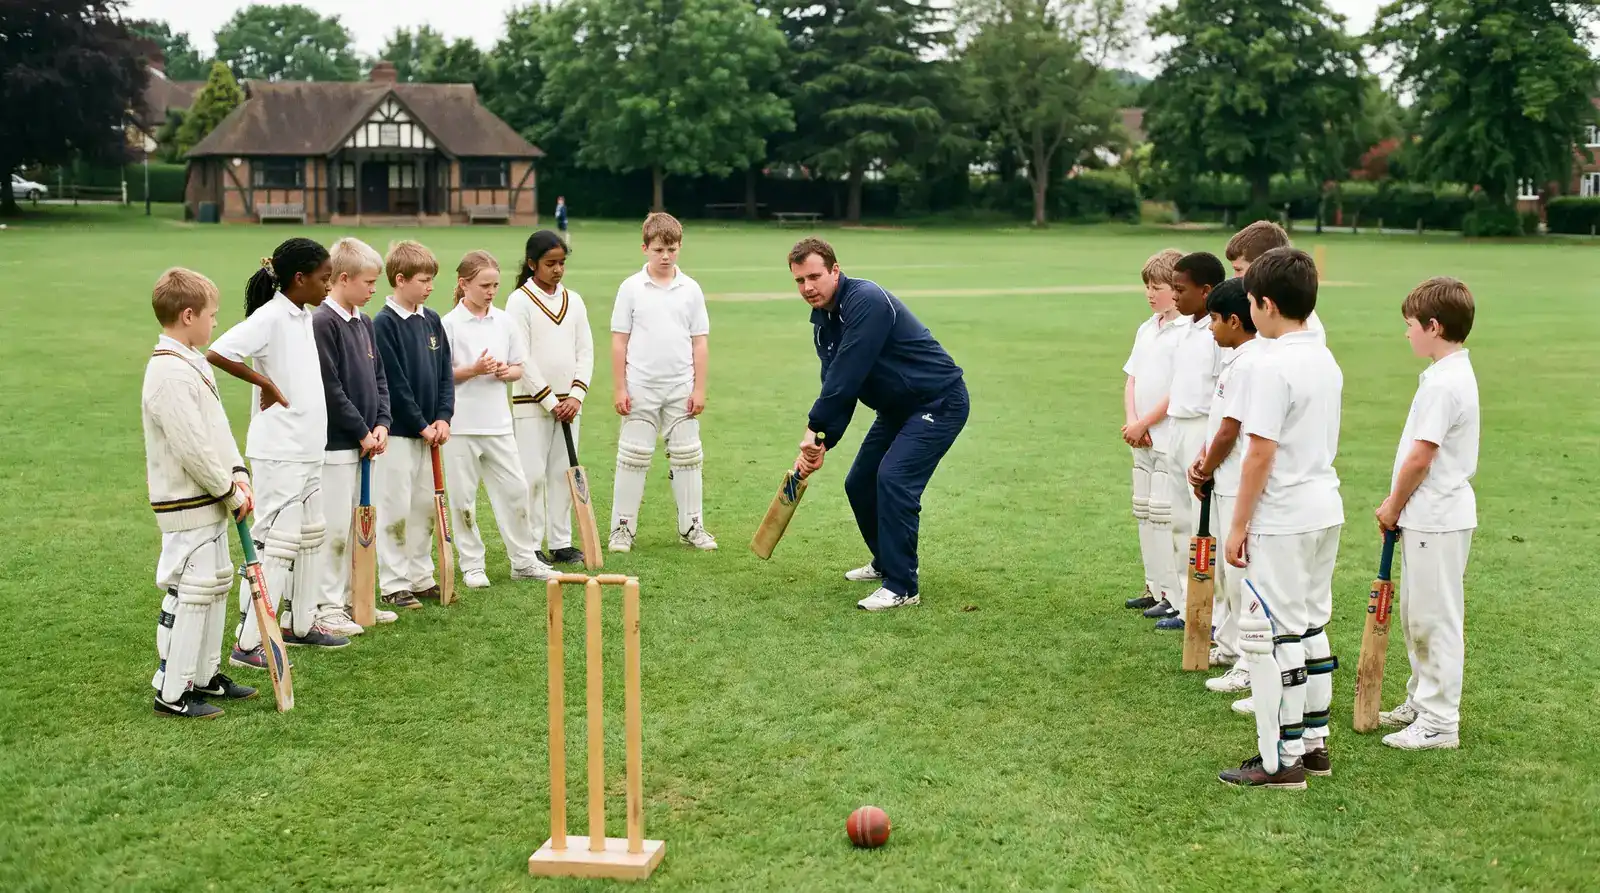
The ECB's All Stars and Dynamos junior programmes registered 106,000 participants in 2025, of whom 32,000 were girls. Both are introductory schemes designed to bring children into cricket through short-format sessions. In parallel, the number of women's teams in England and Wales grew by 18% in 2025 versus the previous year, with girls' teams up 13%. ECB-recorded growth in women's and girls' grassroots cricket overall sits around 10% year-on-year.
The funding picture is significant. ECB has distributed £55 million in grants and £32.2 million across 6,638 recreational cricket projects over four years. The UK government added a further £35 million for grassroots cricket in state schools, targeting 930,000 young people — including 80,000 with special educational needs. That's serious investment in the base of the pyramid, paying out at the live-score end of the sport about ten years later.
The picture isn't uniformly positive. 61% of UK cricket clubs use equipment worn beyond its expected lifespan. Only 16% of clubs receive funding from regional boards or the ECB, and 12% from local authorities. 48% of UK clubs faced match cancellations during the 2025 season due to player shortages. That last figure should worry anybody who cares about whether the sport reaches 2035 with a pipeline intact.
What this means for the live-score watcher is more abstract than the rest of this guide. The scoreboards we tap into at the top — Test, Hundred, T20 Blast — are fed by counties, which are fed by clubs, which are fed by youth and school cricket. When grassroots participation moves, county quality moves a decade later, and what you see on the boundary at Edgbaston shifts again.
Women's Cricket and the UK Live-Score Picture
The women's Hundred final in 2025 drew 22,542 spectators to Lord's — a record crowd for a women's domestic cricket final in this country. I was at a women's county T20 fixture a fortnight later that drew about three hundred. Both numbers are honest. Women's cricket in the UK is simultaneously breaking attendance records at the top and still building infrastructure at the second tier. The live-score picture reflects that uneven curve.
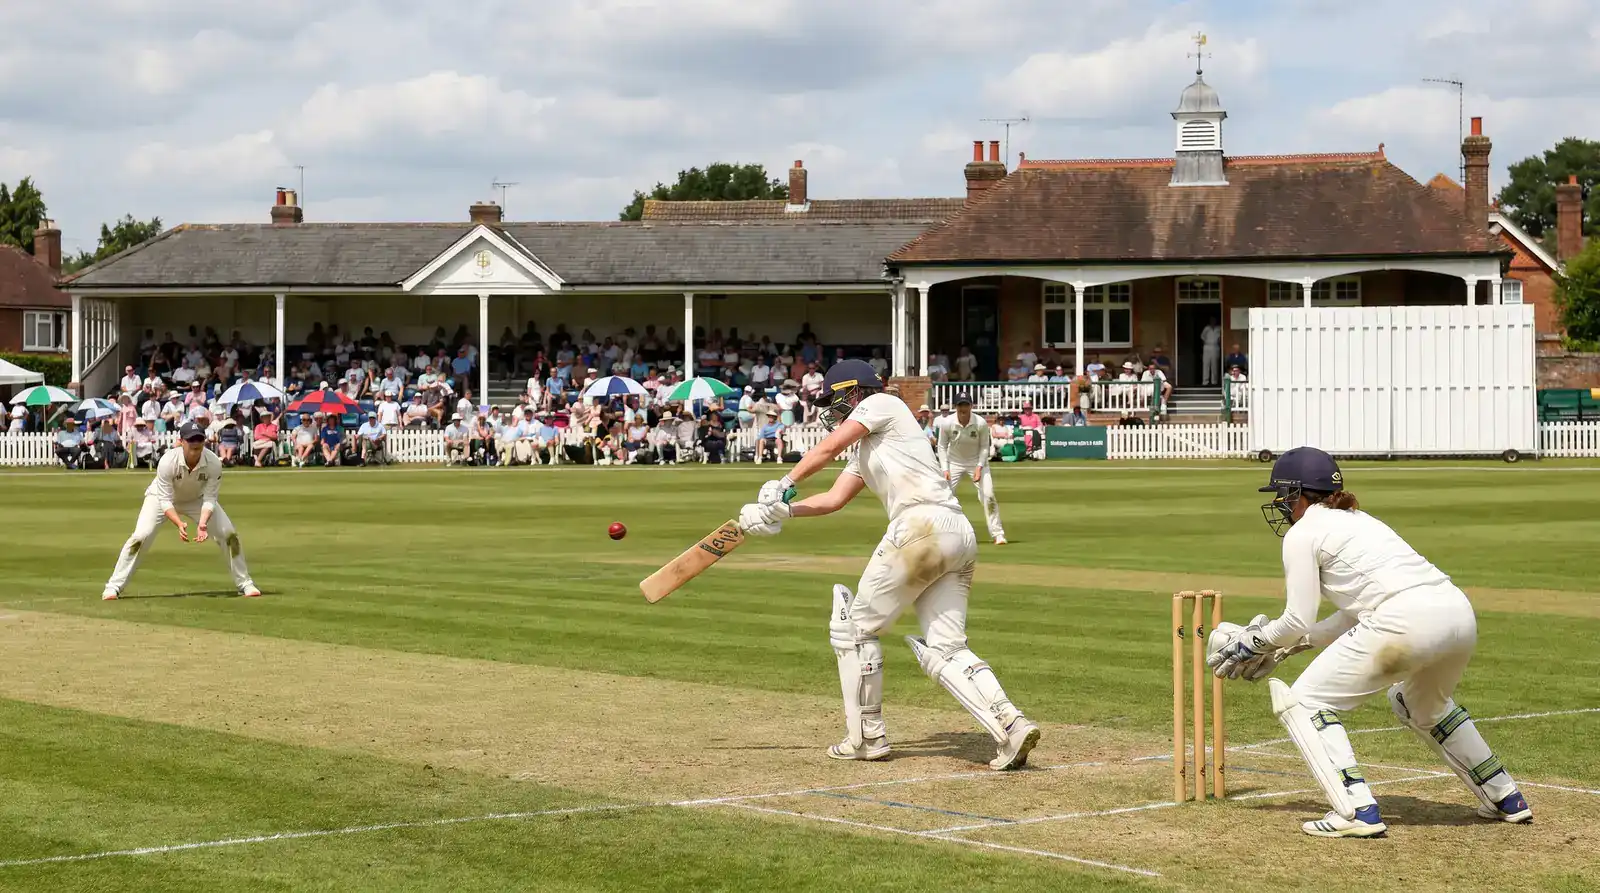
The Hundred has been the single biggest accelerant. Total attendance across the women's Hundred competition reached 349,000 in 2025 — a record figure for women's domestic cricket here. Broader engagement metrics rose alongside the gate. The audience mix at The Hundred overall — across both men's and women's sides of the competition — shows 41% families, 30% women, 23% junior tickets, the kind of demographic spread that historically belonged to football rather than cricket.
The international side of women's cricket is moving in parallel. The 2023 Women's Ashes drew 288% more spectators than the 2019 series. That isn't an incremental rise; that's a category change in how the sport positions and presents women's matches. The live-score traffic around women's England fixtures has grown to match — BBC text commentary, dedicated scorecards on ECB Match Centre, and Sky's broadcast of the home internationals.
What's still patchy is the layer below international and franchise. Women's county cricket — the Tier 2 and Tier 3 structure introduced when the women's game restructured a few years back — is still building its scorecard ecosystem. ECB Match Centre carries the live data, but you have to go looking. Mainstream apps tend to default to men's fixtures unless you customise the filters. That gap is closing every season, but it isn't closed yet.
Where to find women's live scores in the UK: ECB Match Centre (women's domestic competitions, England fixtures), BBC Sport (text commentary on internationals and selected Hundred matches), Sky Sports (live broadcast and scorecard on England home internationals and most Hundred), Cricbuzz and ESPNcricinfo (full coverage of internationals, less depth on Tier 2 county games).
The live-score watcher new to women's cricket should expect two things. First, the broadcast pipeline at the top is now equivalent in quality to the men's — the Hundred women's matches are produced and scored with the same depth. Second, the digital reach of women's county cricket still lags. If you want to follow a Sunday women's Tier 2 game, you'll likely be working off a Play-Cricket scorecard rather than a polished broadcast feed. The sport is still building its second layer. The signs are it'll get there well before the end of this decade.
What People Inside UK Cricket Are Saying
I trust three kinds of voice when I'm trying to understand where UK cricket is heading: people running the boards, people producing broadcasts, and people inside the analytics layer. Each sees a different slice of the live-score story, and the gaps between their views tell you more than any single quote.
ECB's own assessment of where the sport sat at the end of 2024 came from the governing body's annual accounts. Cricket, the report noted, had been competing for engagement in a remarkable sporting summer — the Paris Olympics and the men's football Euros both within the same window. England men hosted West Indies and Sri Lanka in a non-Ashes year, which limits the marquee draw. And yet attendance still hit 2.84 million, the best figure ever for a non-Ashes or non-India year. That sentence, buried in a financial document, captures how the sport reads its own resilience.
Vikram Banerjee, who runs The Hundred for the ECB, framed the demographic shift more directly when the 2025 numbers landed. He pointed to families forming over 40% of the competition's audience as testament to what The Hundred set out to do at launch — bring new audiences into cricket who otherwise wouldn't have come. That's the strategic justification for a format that traditional Test-and-county supporters often eye with suspicion.
The production side has its own perspective. Liz Thorne, who runs senior production at Sky Sports Cricket, has talked about how the broadcaster reshaped its content workflow to support the digital and social-clip layer. Her team now sits down regularly with social media and digital journalists to plan around what younger viewers want — shorter, more instantaneous content rather than just the full broadcast feed. That production shift is what's behind broadcast graphics becoming richer every season, with worm charts and in-game stats appearing alongside the traditional score bar.
The voices don't always align. Boards talk attendance growth and pipeline; broadcasters talk audience reshape and production cost; analysts talk margins and risk. The live score sitting on your phone right now is the visible end of a much larger commercial and production system that all three are continuously negotiating with each other.
Choosing a Live-Score Source for the UK Viewer
I get asked this every season, usually by somebody who's just installed three cricket apps and is annoyed because they're all telling them the same thing slightly differently. The honest answer is that no single source covers UK cricket perfectly. The right stack depends on what you actually want to track.
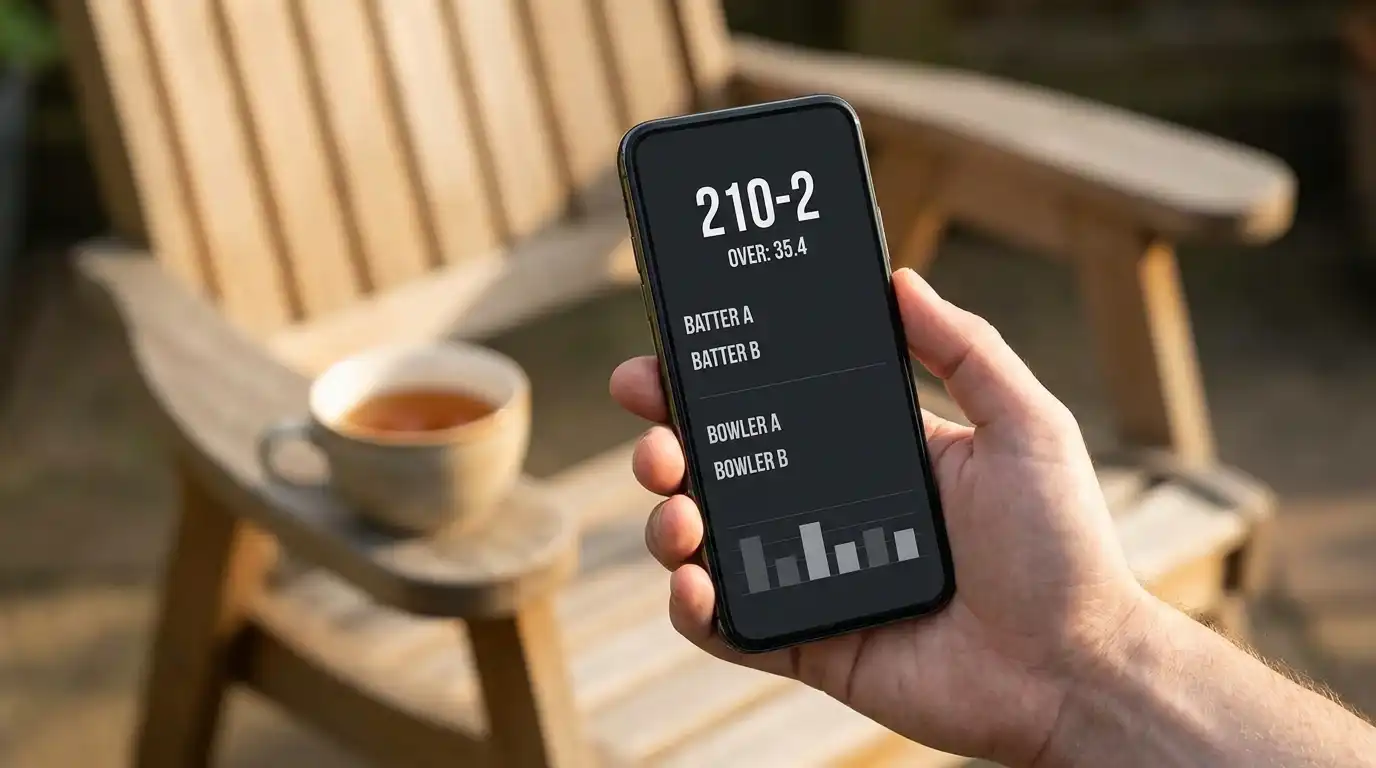
| Use case | Best-fit source type | Trade-off |
|---|---|---|
| Glanceable score during work | BBC Sport app, Flashscore | Lower stat depth |
| Deep ball-by-ball plus stats | ESPNcricinfo, Cricbuzz | Heavier interface |
| County-specific live data | ECB Match Centre | Plainer UX |
| Audio with delayed score | BBC Sounds (Test Match Special) | No visual board |
| Grassroots / club fixtures | Play-Cricket Live | Reliant on volunteer scorers |
The viewer I most often see making a mistake is the one who tries to follow a county four-day match through Cricbuzz or ESPNcricinfo because that's the app they've installed. Both cover County Championship in name, but the depth is shallower than for international cricket. For county-specific data, ECB Match Centre is the cleaner source — plainer interface, first-party numbers.
The honest practical answer for most UK viewers in 2026: a free tier of BBC Sport plus Flashscore covers around 80% of needs. A paid Sky subscription unlocks the live broadcast. A custom stack for deep stats during marquee series adds Cricbuzz or ESPNcricinfo. For grassroots, the ECB's own Match Centre and Play-Cricket fill the gap. That's the working setup, with a heavy thumb on "what do you actually need."
Live Scores and Coverage Queries Answered
Where can I check live cricket scores in the UK right now without a subscription?
The BBC Sport app and website carry live scorecards for all major international and domestic matches without any paywall, including text commentary on most England fixtures and selected Hundred games. Flashscore covers everything else with the same model. The ECB's Match Centre is the cleanest source for county-specific live data and is also free. None of these requires Sky, TNT or any other paid service. The only thing you don't get without subscription is the live broadcast itself — the numbers and ball-by-ball events are available to anyone.
What do the numbers like "250/4 d" and "7.2 RR" mean on a scoreboard?
The "250/4" part says the team has scored 250 runs and lost 4 wickets. The "d" indicates a declared innings — the batting captain closed the innings early rather than batting on, usually because they want to bowl at the opposition before stumps or want time to win the match. The "7.2 RR" is the run rate: an average of 7.2 runs per over so far. In a T20 that's strong; in a Test it would be unusually fast. The shorthand stacks information densely because the line has to be readable at a glance from a pavilion board.
How are Test, ODI, T20 and The Hundred different in scoring rules?
Each format gives the batting side a different ration of balls and a different shape of restrictions. Test cricket has no over limit and runs across up to five days. ODIs give each side 50 overs (300 balls) with three powerplay phases. T20s give each side 20 overs (120 balls) with a six-over powerplay. The Hundred gives each side 100 balls delivered in five-ball sets, with a 25-ball restricted phase and bowler quotas capped at 20 balls. The shorter the format, the higher the per-ball scoring rate becomes, and the more aggressive the scoreboard looks.
What is DRS and how often does it change a decision?
DRS is the Decision Review System — a process by which teams can challenge an on-field umpire's decision using video replays, ball-tracking and edge detection. Each side has a limited number of reviews per innings. DRS has lifted the overall accuracy of decisions from around 93% to over 98%, and after the 2021 wicket-zone tweak, the overturn rate on non-umpire's-call LBW reviews climbed from 22% to 27%. Roughly 15% of Test-match wickets involve DRS in some form, though the share is much smaller in shorter formats where there are fewer dismissals overall.
Why does the target sometimes change mid-match — the DLS Method?
When rain interrupts a limited-overs match and reduces the overs available, the Duckworth-Lewis-Stern method recalculates a fair target based on "resources" rather than just overs. Resources combine the balls left and the wickets in hand. If the chasing side loses a chunk of overs, the algorithm sets a revised target that reflects the reduced batting opportunity. The new target is typically labelled on broadcast graphics as "DLS revised target" or as a "DLS par" score. It can feel counter-intuitive — sometimes lowering the target by less than viewers expect — because the maths weights wickets-in-hand heavily.
Which cricket apps are most popular with UK viewers in 2026?
The mass-market apps for UK fans are BBC Sport (free, default for many), Flashscore (free, broad coverage), ESPNcricinfo and Cricbuzz (both free, deeper international stats), and the ECB's Match Centre (best for county data). Cricbuzz has crossed 100 million Android downloads globally and ESPNcricinfo has reached about 24 million. Neither was built specifically for the UK market, but both serve UK fans well. For audio, BBC Sounds carries Test Match Special. For grassroots, Play-Cricket Live remains the standard.
Where can I follow The Ashes coverage in the UK?
Live broadcast rights for The Ashes — whether at home or away — sit with Sky Sports Cricket in the UK. BBC carries highlights and text commentary, and Test Match Special on BBC Sounds runs ball-by-ball audio for every day's play. Away series produce overnight scheduling, so many UK viewers default to the radio overnight and the highlights show the following evening. The 2023 Ashes drew a peak UK TV audience of 2.12 million for the men's series — the highest since cricket left free-to-air in 2005 — with cumulative reach of 17.8 million across the whole series.
Created by the "Stumply" editorial team.
