
Batting Strike Rate Explained: What the Number Tells You and What It Hides
 Available in US
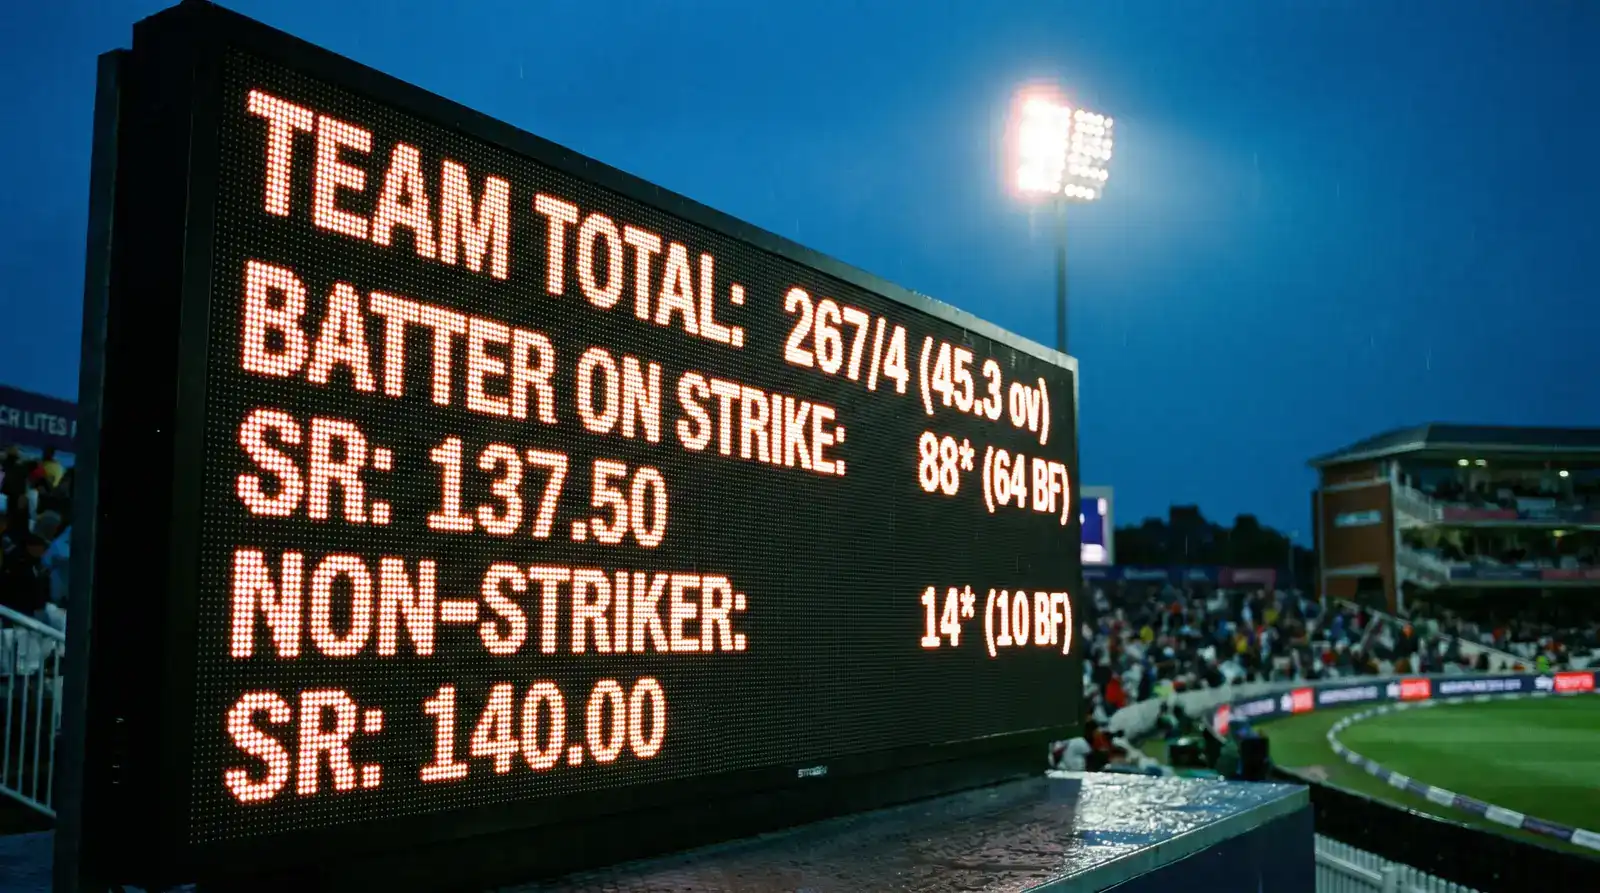
The Stat That Sounds Simpler Than It Is
A friend who has watched cricket for thirty years asked me last summer what strike rate actually meant, and when I tried to explain it I realised I had been using the number for so long that I had stopped thinking about what it represents. Strike rate is one of the most quoted batting statistics in modern cricket. It is also one of the most context-dependent. The same number can describe a brilliant innings or a self-defeating one, depending entirely on what was happening around it.

This is what the number actually measures, where it is genuinely useful, and the situations where it leads you to the wrong conclusion if you read it without context.
The Basic Calculation
Strike rate is runs scored per 100 balls faced. The formula is runs divided by balls faced, then multiplied by 100. A batter who scores 50 off 40 balls has a strike rate of 125. A batter who scores 100 off 200 balls has a strike rate of 50. The unit is fixed at 100 balls regardless of format, which is what makes the number portable between Tests, ODIs, T20s and the Hundred.
The choice of 100 as the denominator is arbitrary but useful — it produces numbers that are easy to compare at a glance. A strike rate above 100 means the batter is scoring more than a run per ball, which is the rough benchmark for white-ball cricket aggression. A strike rate below 50 means the batter is scoring slower than one run per two balls, which in modern Test cricket is starting to look defensive.
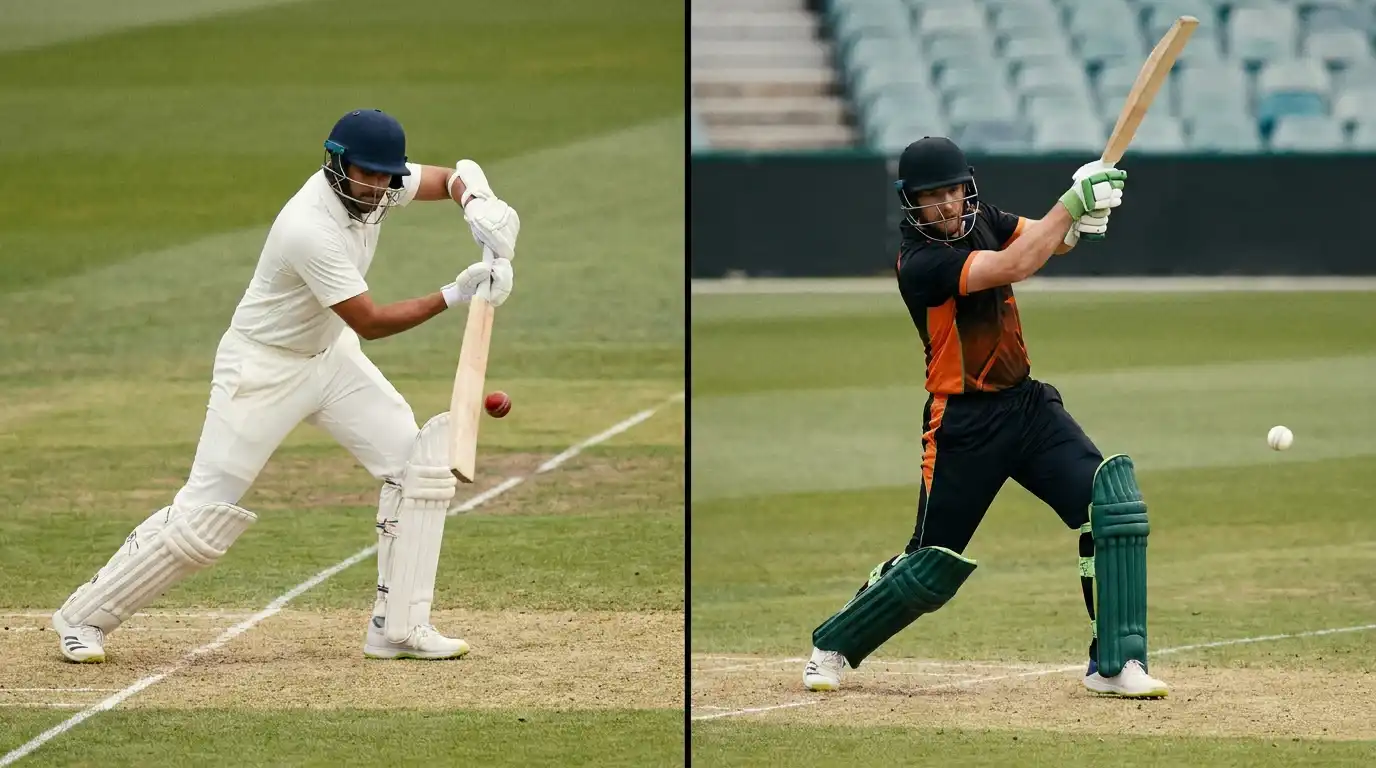
The scorecard shortcuts you see on broadcast graphics — SR for strike rate, BF for balls faced, R for runs — let you reconstruct the calculation in your head from any line of the card. If you want a deeper look at how the abbreviations and notation conventions work, the broader topic of reading a live cricket scorecard covers the whole layout including how strike rate fits into the wider information set.
What the Number Is Useful For
Strike rate is most useful as a per-format benchmark. The expected range for a top-order batter differs significantly by format, and the number is meaningless without the format context.
In Test cricket, a top-order batter scoring at a strike rate of 50 to 60 is operating at a strong but sustainable rate. Above 70 is genuinely fast. Below 35 is starting to look attritional. The classic Test innings of 100 off 220 balls has a strike rate of around 45, which sounds slow until you remember that the bowling side is trying to attack the stumps every ball and the batter is surviving against the new ball, the reverse-swinging old ball, and the spinner on a fifth-day pitch.

In ODI cricket, the benchmark shifts. A top-order batter scoring at 80 is competitive, at 100 is good, and at 130 is exceptional. The middle order is expected to push higher — finishers operate at 140 to 180 over the closing overs.
In T20 and Hundred cricket, the strike rate becomes the central metric. A top-order T20 batter at 120 is solid, at 140 is good, at 160 is excellent. A finisher who closes a chase at 200-plus is the type of innings that wins matches. The Hundred uses the same calculation but compresses the format to 100 balls per side, so individual strike rates trend slightly higher than T20 because of the format’s shorter pressure window — there is less time for a batter to settle, and the ones who succeed are the ones who get going immediately.
The Situations Where Strike Rate Lies
Strike rate is a per-ball average, which means it hides the distribution of scoring. A batter who faces 40 balls and scores 50 runs has a strike rate of 125. But that 50 could be a string of singles and twos with steady accumulation, or it could be ten dot balls followed by a sequence of fours and sixes. The two innings look identical on the scorecard. They are completely different innings in terms of what they cost the bowling side.
The dot-ball percentage is the corrective. A batter with a strike rate of 125 and a dot-ball rate of 50 percent is rotating poorly and relying on boundaries to lift the average. A batter with the same strike rate and a dot-ball rate of 25 percent is keeping the scoreboard moving constantly. The two profiles produce different pressure on the bowling side and different risk profiles for the batter themselves.

The match situation is the other context that strike rate hides. A batter scoring 30 off 40 balls in a Test match’s third session, when the team needs to bat out the day to save the match, has a strike rate of 75 — which looks slow in isolation. In that situation it is exactly the rate the team needs. The same 30 off 40 in a T20 powerplay, when the team needs to attack the bowling restrictions, is too slow by half. The number is identical. The judgement of the innings is opposite.
This is why a single strike rate read out of context tells you almost nothing about the quality of the innings. The number needs to sit alongside the match situation, the format, the bowling attack faced, the position in the batting order, and the dot-ball distribution before it becomes meaningful.
How the Bowling Side Reads Strike Rate
The bowling captain’s tactical decisions are driven heavily by the batter’s running strike rate. A batter who has just walked in and faced two dots will have a strike rate of zero. The captain knows the batter is in the settling phase and can attack with fielders close on the off side, expecting defensive shots. Once the batter has faced twenty balls and accumulated a strike rate of around 80, the captain knows the batter has timed the pitch and is into their rhythm — and the field has to spread.
The bowler’s economy rate is the inverse measure. Strike rate from the batter’s perspective is runs per 100 balls; economy rate from the bowler’s perspective is runs per six balls — the over. The two numbers measure the same exchange from opposite sides. A bowler with an economy of 6 has conceded roughly 100 runs per 100 balls, which is a batting strike rate of 100. The arithmetic ties the two metrics together.
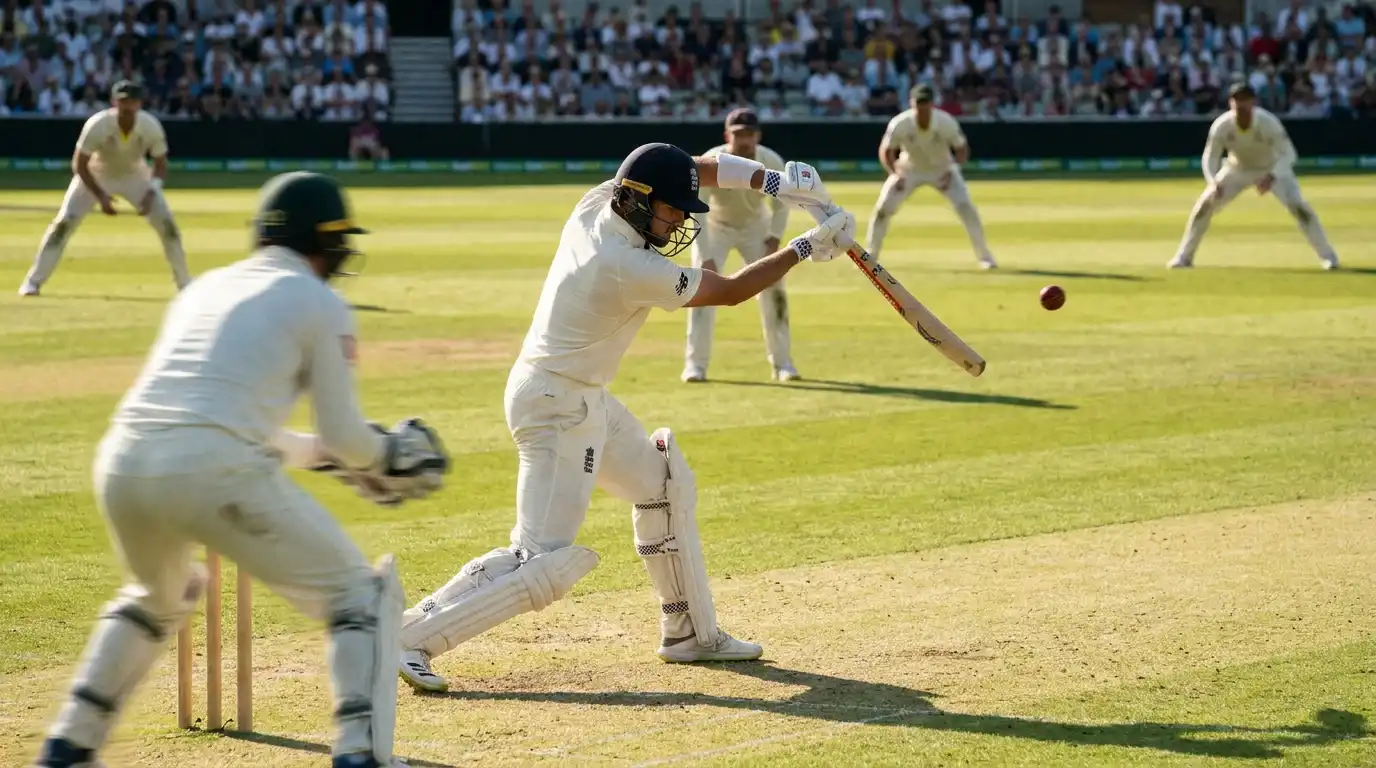
In limited-overs cricket, the bowling side is trying to keep the partnership’s combined strike rate below the required run rate. If the side batting second needs 8 an over to chase, they need a partnership strike rate of around 133. Below that and they are falling behind. Above that and they are setting up the closing overs with momentum. The strike rate is the live indicator of whether the chase is on schedule.
The Numbers That Have Changed Over the Past Decade
White-ball strike rates have crept upward across all formats since 2015. ODI top-order strike rates that would have been excellent in 2010 — around 90 to 95 — are now merely competent. The expected rate for a top-order ODI batter is closer to 100, with the leading openers comfortably above 110. The shift is driven by the influence of T20 batting techniques migrating into the longer white-ball format.
T20 strike rates have also risen, with top-order rates moving from around 130 as the benchmark in 2015 to 140-plus now. The Hundred has compressed this further — the format’s design rewards immediate aggression, and the leading batters in the competition strike at rates that would have been outliers a decade ago.
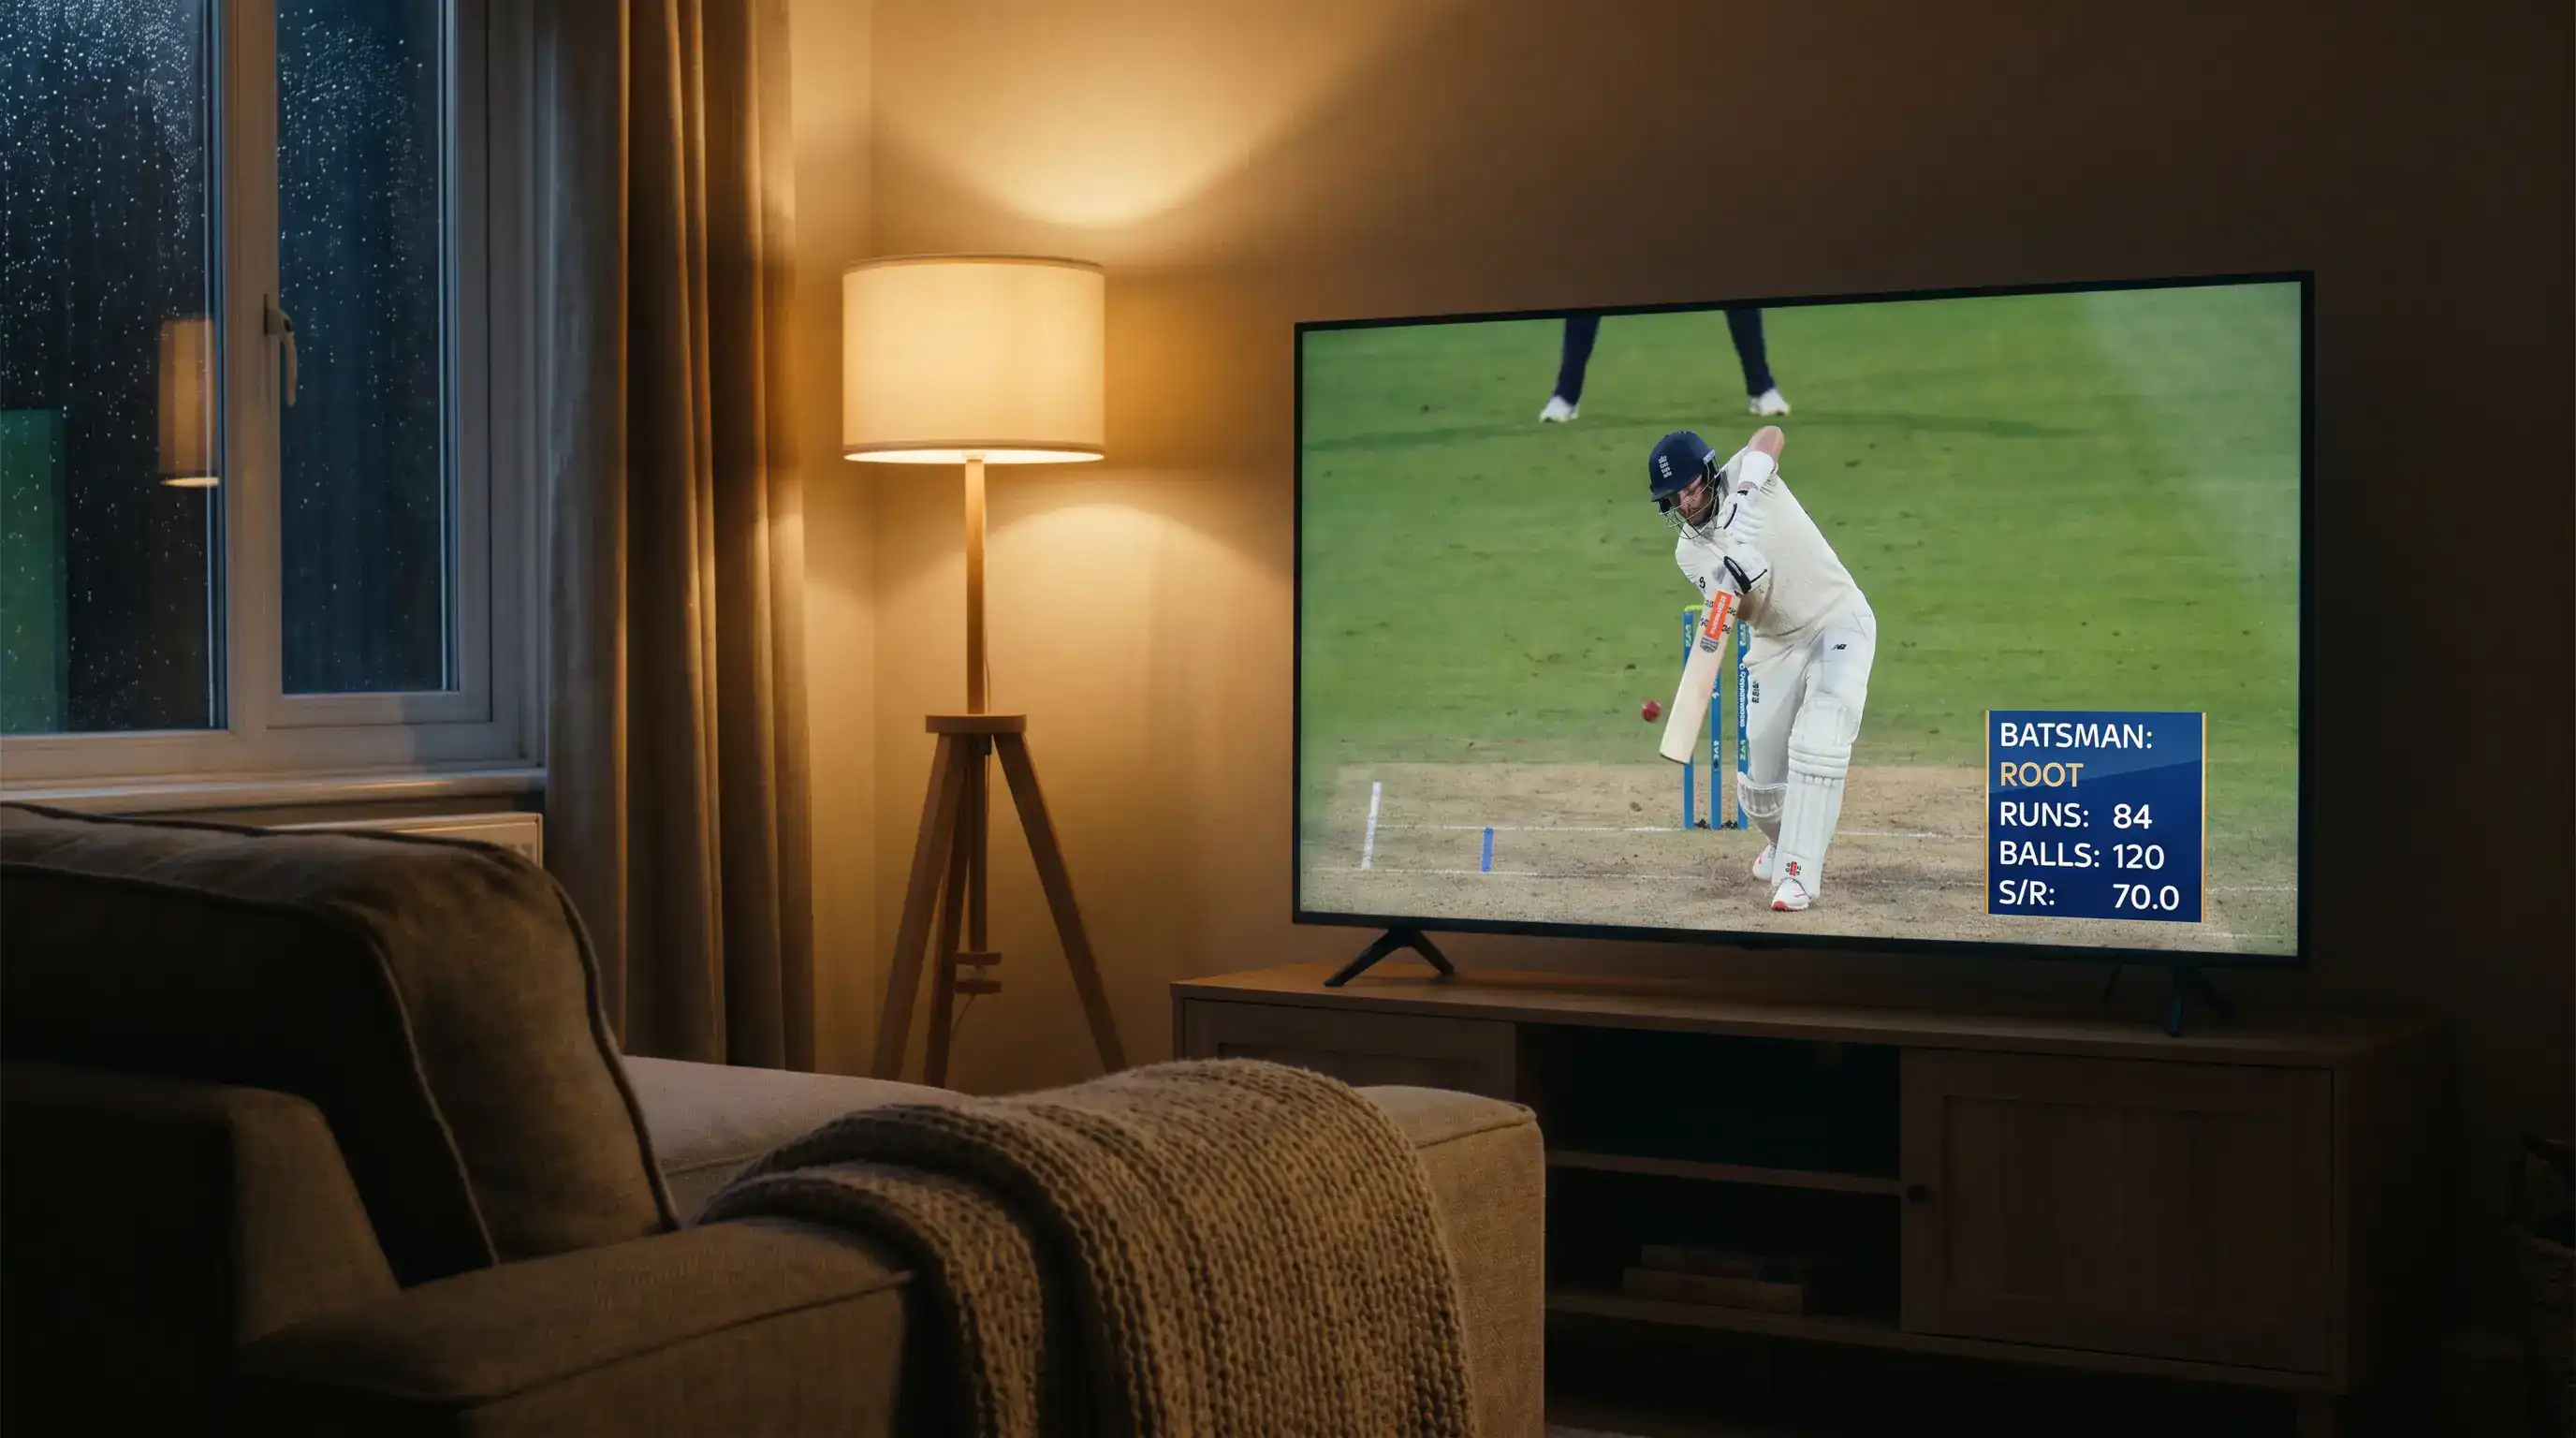
Test strike rates have moved in the same direction but more slowly. The Bazball approach to Test batting that England have used since 2022 has pushed Test strike rates above 70 for sustained periods, which would have been considered reckless in the 1990s. The format absorbs higher strike rates because the games are long enough for the risk to be offset by the scoring acceleration.
What this means for reading the number today is that the benchmarks need to be calibrated to recent norms rather than historical ones. A T20 strike rate of 130 is no longer a strong number — it is average. A Test strike rate of 60 is no longer fast — it is the new normal for an attacking top-order batter. The number itself has not changed, but the population of innings against which you compare it has shifted upward.
Reading Strike Rate Live During a Match
The most useful habit when watching cricket is to read strike rate as a velocity rather than a score. A batter at 30 off 25 balls is travelling at 120. The question is not whether 30 is a lot of runs, but whether 120 is fast enough for the situation. If the team needs 8 an over and the batter is at 120, they are roughly on rate. If they need 10 an over and the batter is at 100, they are losing ground.
The velocity reading also tells you about the bowler. A bowler whose figures show 2 for 28 off 4 overs has conceded 28 runs in 24 balls — a strike rate against them of 117. If the team batting second needs 9 an over, that bowler is being scored off at exactly the required rate, which means the captain might keep them on. If the team needs 7 an over, the bowler is being attacked above the required rate and the captain has a problem. The same figures mean different things depending on the match state.
This is the habit that turns a casual viewer into one who follows the match strategically. The numbers on the screen are not just descriptive — they are the inputs to every decision the captain is making in real time. Strike rate is one of the cleanest signals among them, provided you read it as a velocity in context rather than a score in isolation.
Prepared by the Stumply editorial staff.
