
What Does Run Rate Mean and How to Read RRR on a Live Score
 Available in US
The Single Number That Drives a Run Chase
Years ago I watched a friend who had never seen cricket before sit down to a tight T20 chase. Within ten minutes she had stopped asking what wickets meant and was asking the only question that mattered: are we ahead or behind? The number on the screen that answered her, ball after ball, was the run rate. Every cricket viewer learns this one eventually, even when nothing else clicks.
Run rate is the average number of runs scored per over. It is the heartbeat of any limited-overs match and the most visible piece of maths on a live scoreboard. Two related numbers do the heavy lifting alongside it: the required run rate during a chase, and the projected total during a first innings. Together, they answer the question my friend asked — are we ahead or behind, and by how much.

The thing I tell anyone new to following live scores is to stop watching the runs total alone. The total is the past. The run rate is the present. The required run rate is the future. Read all three and the chase makes sense even without watching a single ball.
Current Run Rate vs Required Run Rate
The current run rate, often abbreviated CRR on UK scorecards, is straightforward. Divide the team’s runs by the overs faced. After 10 overs at 62 runs, the CRR is 6.20. After 15 overs at 95 runs, it is 6.33. The number updates ball by ball and tells you how fast the batting side is scoring right now.
The required run rate, abbreviated RRR, is the equivalent calculation for the future. Divide the runs still needed by the overs remaining. A team needing 84 from 14 overs has an RRR of 6.00. Get a boundary and they need 80 from 13.5 overs — the RRR ticks to 5.85. Concede a dot ball and they need 84 from 13.5 — the RRR rises to 6.22.
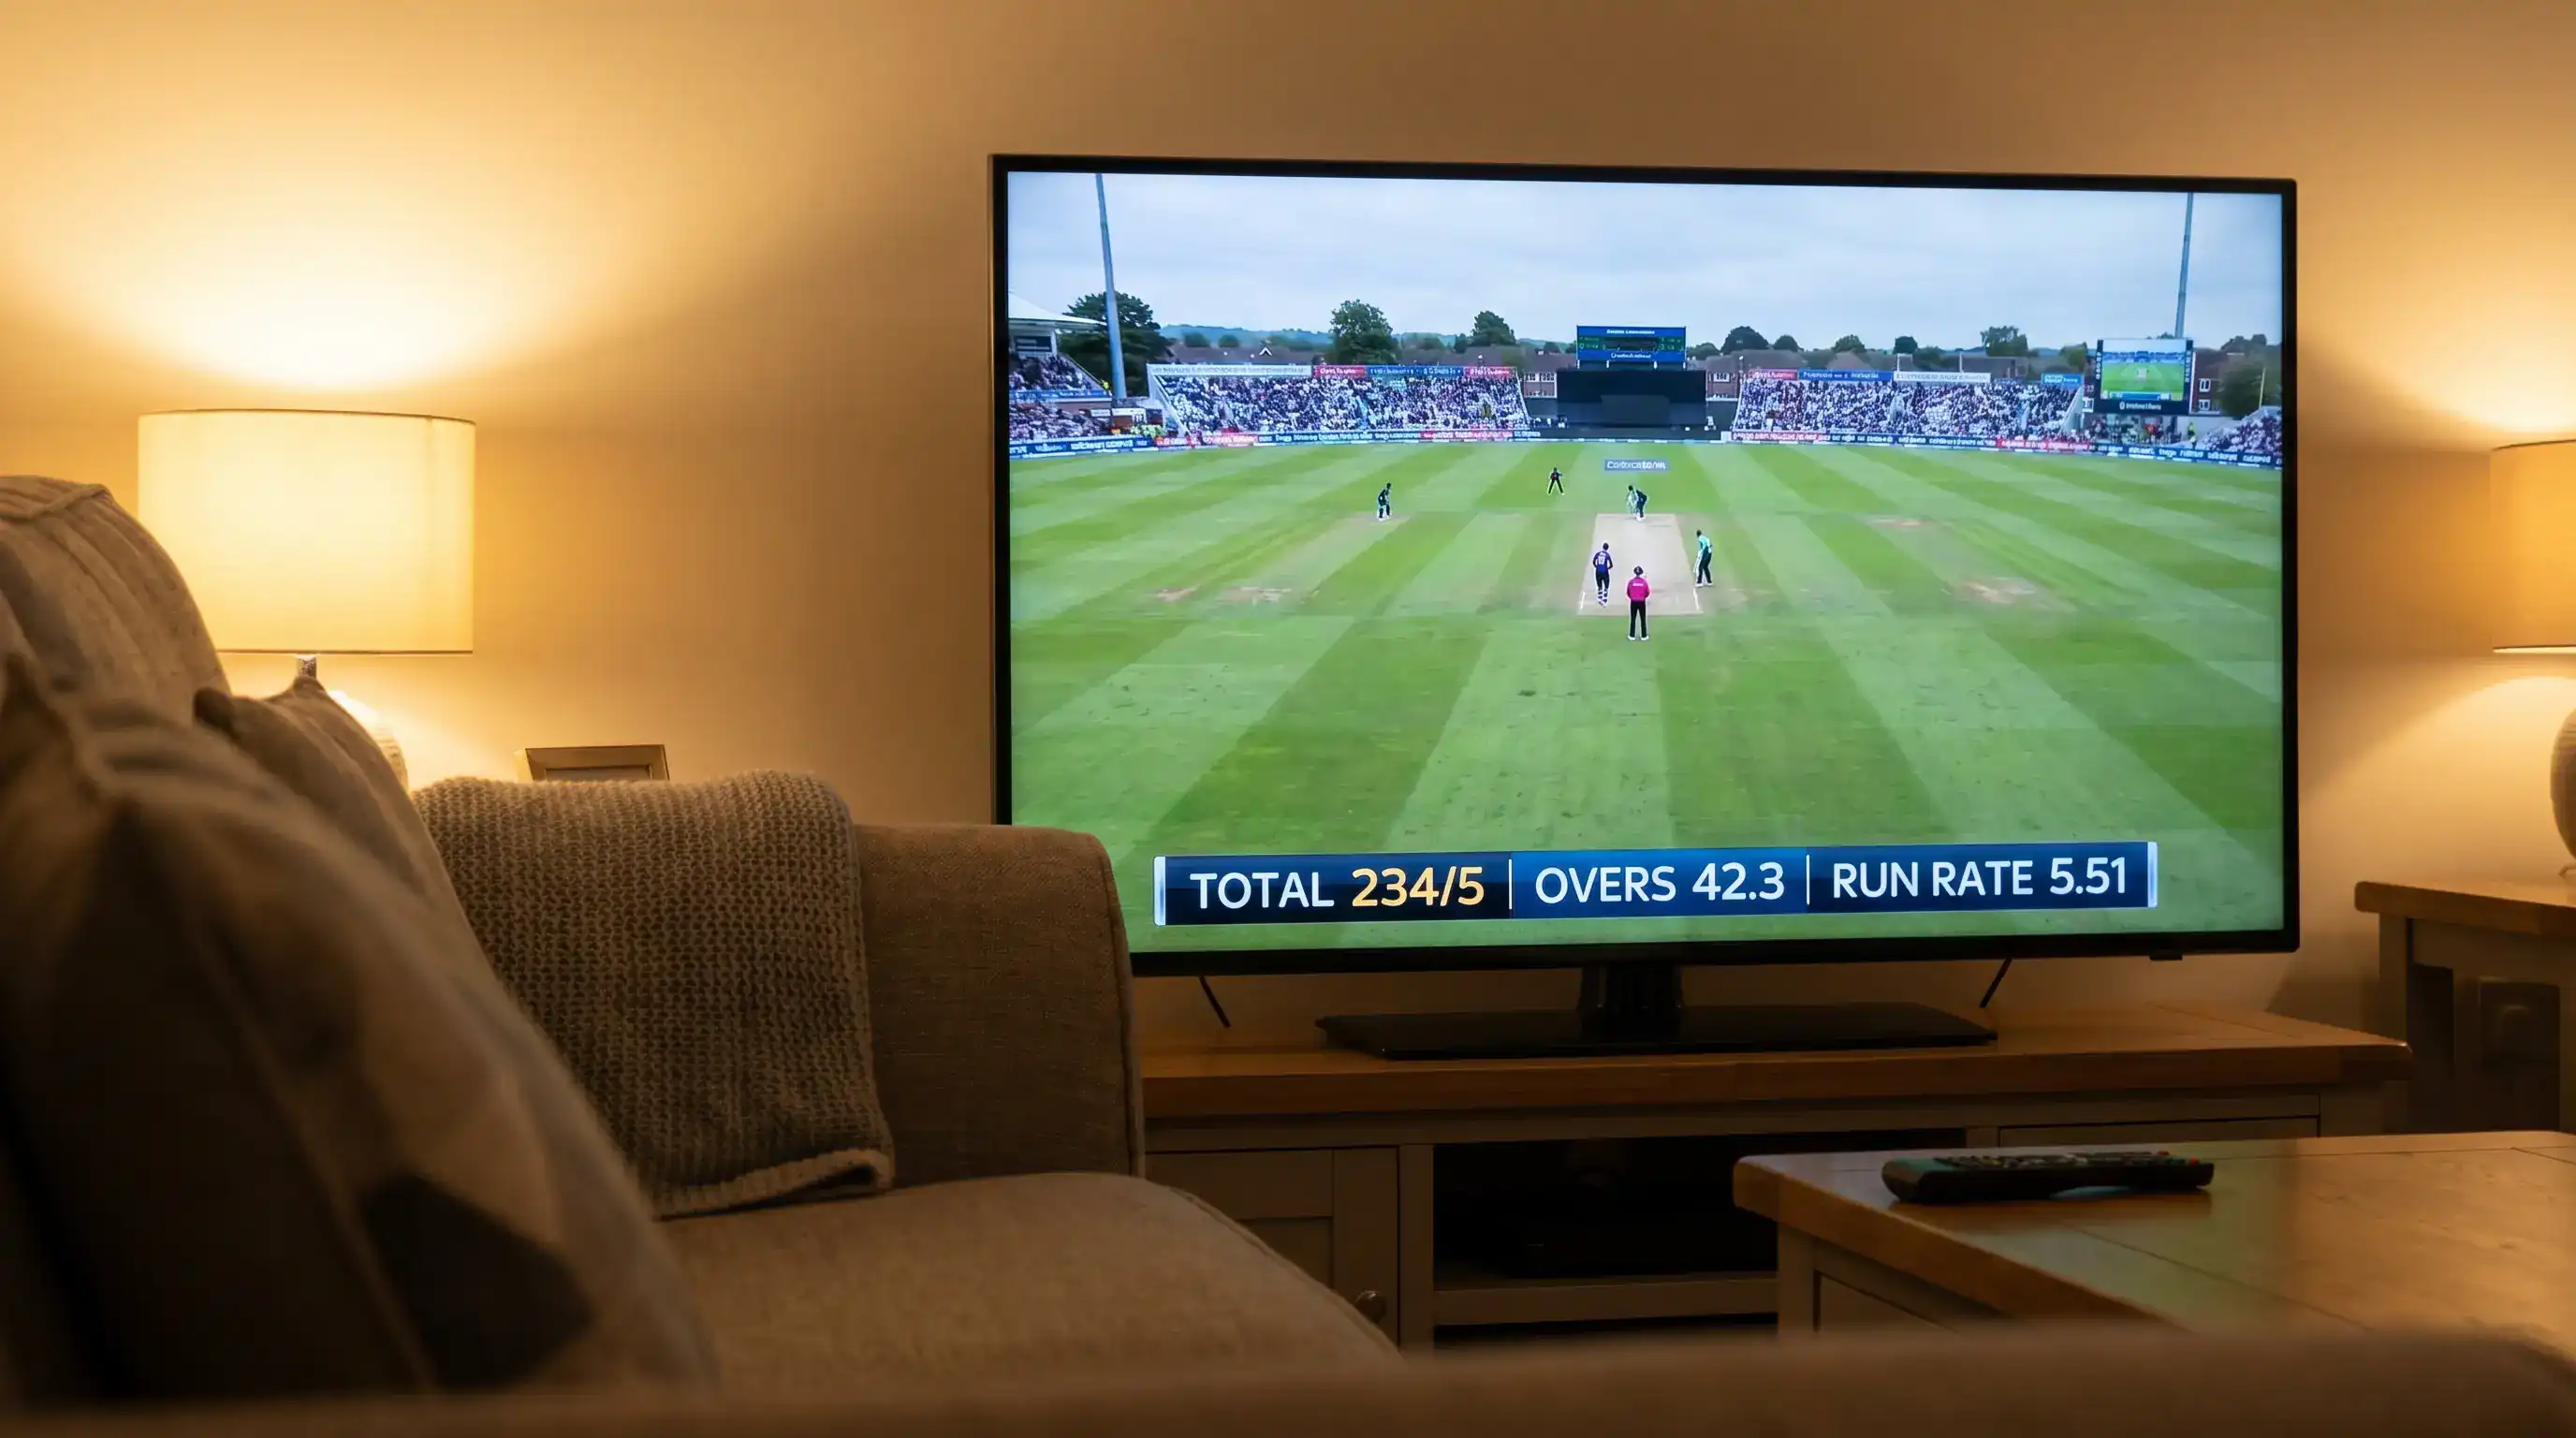
The key thing to internalise is that the CRR and RRR move in opposite directions during the chase. Score quickly and the CRR rises while the RRR falls. Score slowly and the CRR falls while the RRR rises. The pivot point is whether the CRR is above or below the RRR. If CRR is higher, the team is ahead. If RRR is higher, they are behind. The gap between the two numbers is the size of the margin.
This is the closest cricket gets to a real-time win probability. It is not perfect — wickets in hand matter too, and weather matters — but for the basic question of who is winning right now, the CRR-RRR comparison is the cleanest reading available.
How RRR Is Recalculated Ball by Ball
The RRR update mechanism is worth understanding because it explains why a chasing team can look fine for ten overs and then suddenly look in trouble after a single bad over.
The maths is simple but unforgiving. Each ball changes one of two variables: runs needed, or balls remaining. A dot ball changes only the second. A scored run changes the first. The RRR is the ratio of the two, multiplied by six to express it as runs per over. The system recalculates after every legal delivery, and the new figure flashes up on the scoreboard before the next ball is delivered.

Imagine a side needing 50 from 30 balls — an RRR of 10.00. A six brings it to 44 from 29 balls — an RRR of 9.10. A wide brings it to 49 from 29 balls — an RRR of 10.14. Three consecutive dot balls take it from 50 from 30 to 50 from 27 — an RRR of 11.11. The drop from 10.00 to 11.11 in three balls is the price of inertia, and it explains why batters in the death overs cannot afford to play themselves in.
This is why I always tell viewers to watch the RRR rather than the run total during a chase. The total tells you what has happened. The RRR tells you what needs to happen next. Two teams on 100 after 15 overs in a 20-over match are in very different positions if one is chasing 180 and the other 160 — the totals look identical, the RRRs are wildly different.
Projected Totals and Par on Live Scoreboards
For the first innings of a limited-overs match, the projected total replaces the RRR as the relevant forward-looking number. The calculation is the same maths in reverse: take the current run rate and multiply by the total overs to estimate the final score.
A team at 80 for 2 after 10 overs in a 20-over match is running at 8.00. Project that across 20 overs and you get 160. The scoreboard usually displays both the CRR and the projected total during the first innings, and the projection updates ball by ball just like the RRR does.
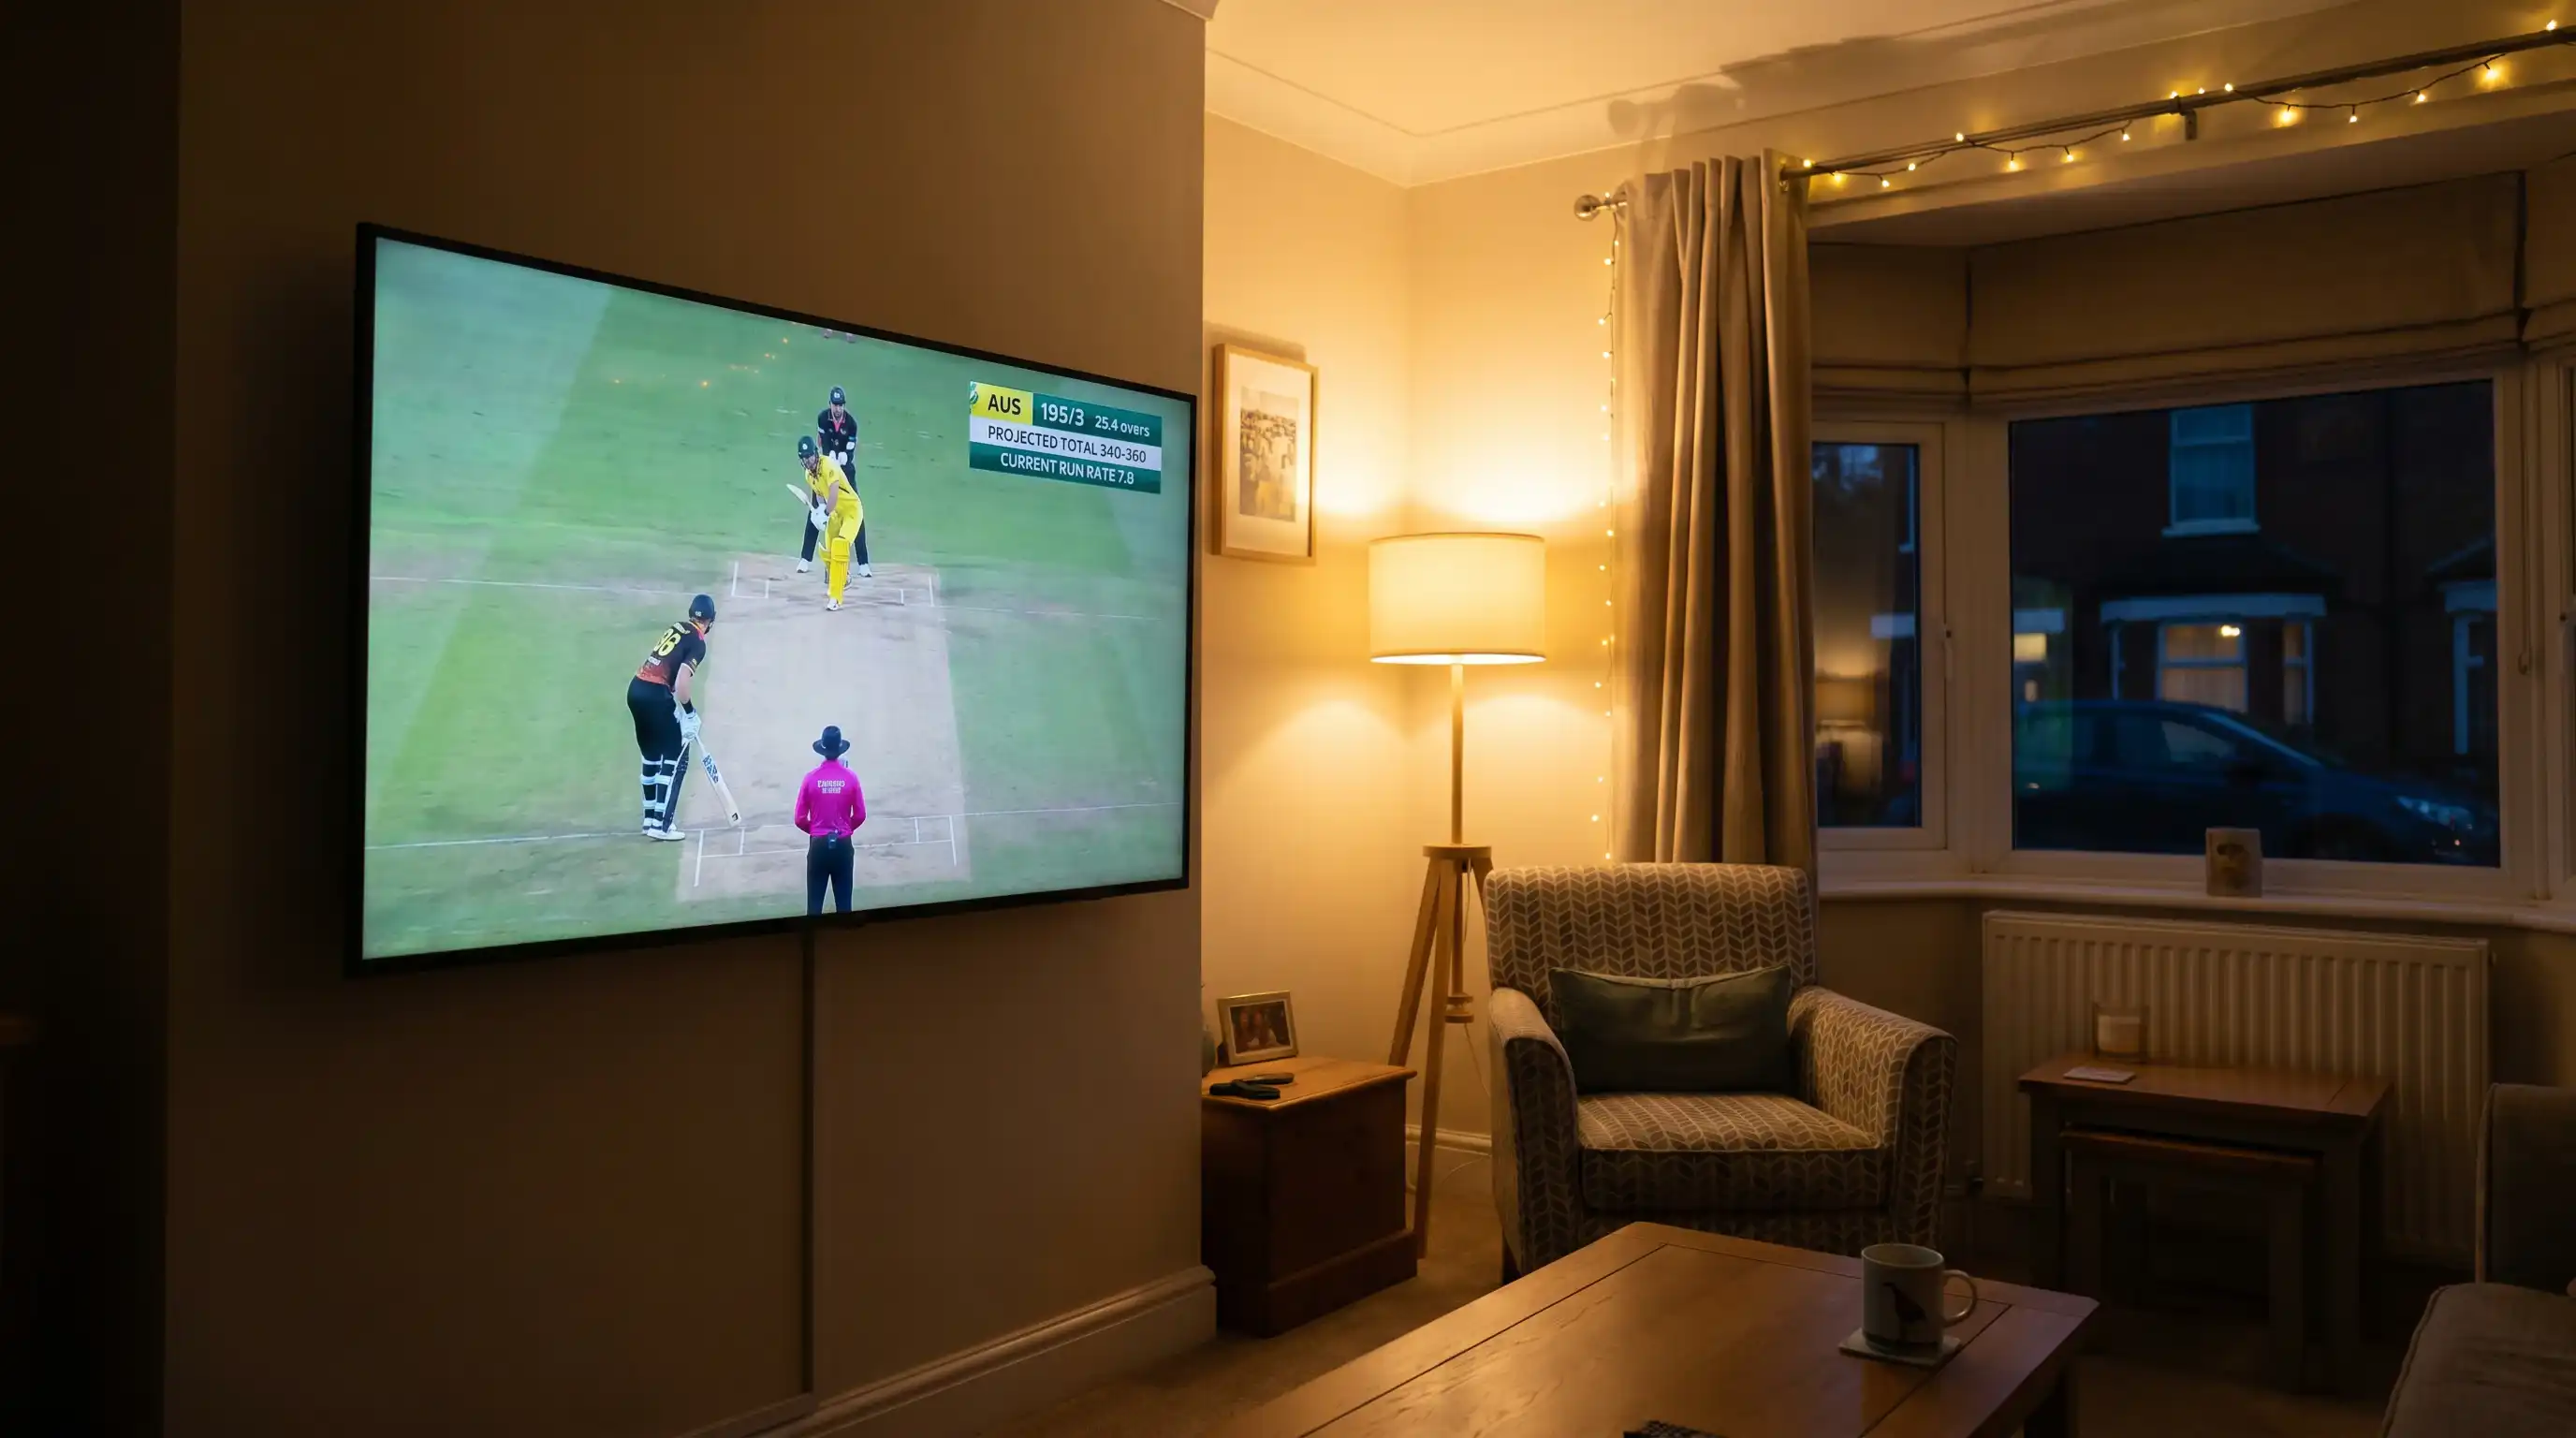
The catch is that projections assume the current rate continues, which it almost never does in T20. Powerplay scoring is faster than middle-overs scoring, and death-overs scoring is faster still. A projection at the end of the powerplay tends to understate the final total because the death-overs surge has not happened yet. Experienced viewers in the UK adjust the projection mentally — a side at 60 for 1 after the powerplay in T20 is likely heading for 180, not the 150 the straight projection would suggest.
Some scorecards also show a “par” figure during a chase, particularly in matches affected by weather. Par is not the same as the chase requirement — it comes from the DLS resource calculation and reflects what the team needs to be ahead of at this moment to win if the innings ends now. Par and RRR can sit beside each other on a scoreboard during a rain-threatened chase, and they answer different questions: RRR assumes the full innings will be played, par assumes it might not be.
Why a “Good” Run Rate Depends on the Format
This is where I see the most confused commentary from viewers who follow cricket sporadically. A run rate of 5.50 in a Test match is electric. The same rate in a T20 is a disaster. The number alone tells you nothing without the format context.
In Test cricket, run rate is rarely the headline statistic. Teams set a tempo based on the conditions and the match situation, and a rate of three runs per over for a session can be entirely respectable on a green pitch. The number that matters in Tests is the partnership total, the lead, and the time remaining in the match.
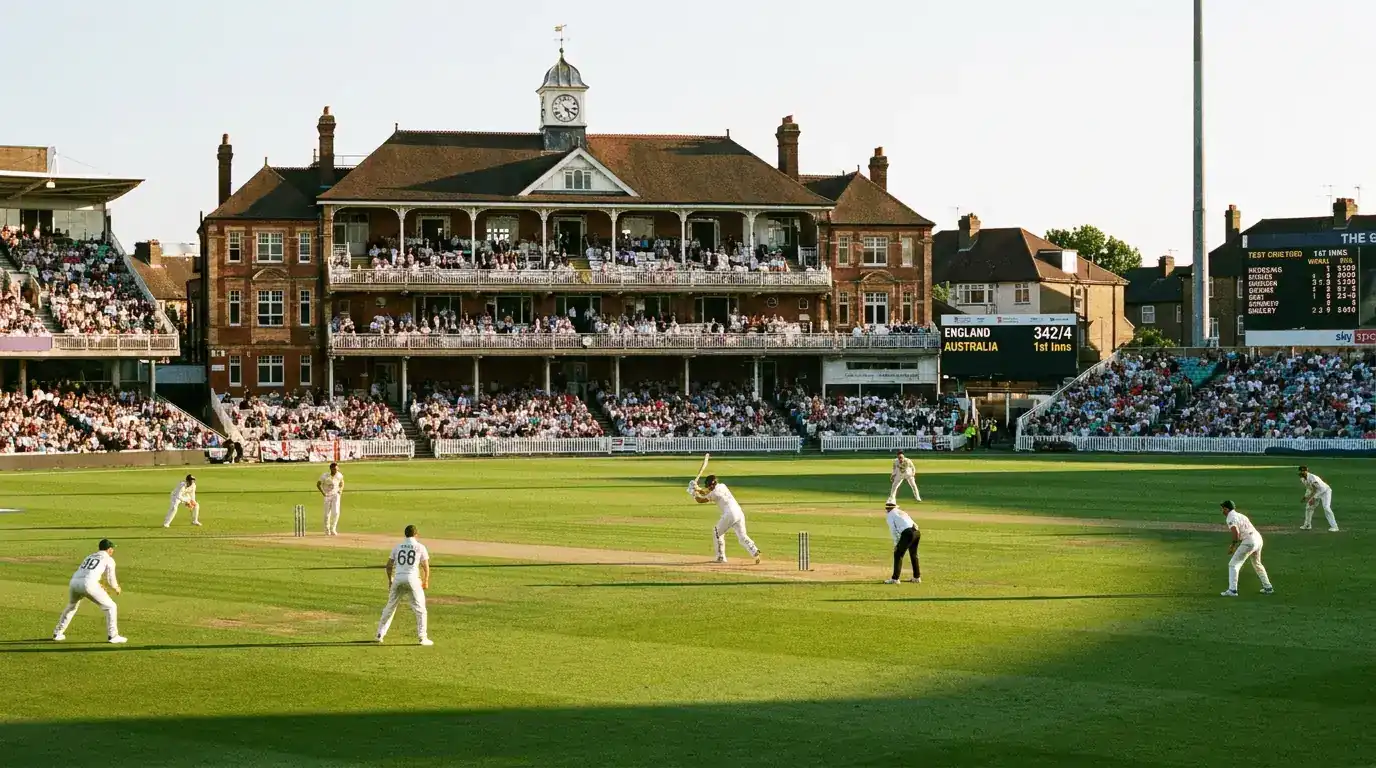
In ODI cricket, the modern baseline is around 5.50 to 6.00 across a full innings. Anything above 7.00 is aggressive. Anything below 4.50 is sluggish. The 50-over format gives sides time to recover from slow patches, so the run rate at any single point matters less than the trajectory across the innings.
In T20, the baseline shifts again. A run rate of 8.00 is roughly the par for a competitive total, and anything below 7.00 by the halfway point puts a side under pressure. The T20 Blast in England regularly sees finishes above 9.00, and chases of 200-plus have become standard rather than exceptional. The 2025 T20 Blast saw plenty of finals-day totals where the chasing side needed double digits in the final overs.
The Hundred adds another wrinkle. With 100 balls per innings rather than 120, the run rate is expressed differently — sometimes as runs per ten balls, sometimes converted to a runs-per-over equivalent. The strategic shape is similar to T20, but the rate baselines are not directly comparable. A score of 150 in 100 balls is roughly equivalent to a T20 total of 180, and the scoring is compressed.
If you want to see how run rate sits alongside the rest of the scorecard furniture — extras, fall of wickets, partnerships — there is more in our cricket scorecard guide. The number on its own is only half the picture.
Prepared by the Stumply editorial staff.
