
Batting Statistics in Cricket: Average, Strike Rate and What They Hide
 Available in US
The Three Numbers Every UK Viewer Sees First
Open any cricket scorecard during a Test match and three batting numbers will catch your eye before anything else: the runs scored, the average, and the strike rate. They appear on the broadcast graphic when a new batter walks to the crease, on the scorecard line throughout the innings, and on every commentator’s lips during the build-up to a milestone. These three numbers carry most of what a casual viewer learns about a batter in real time. The trouble is that all three can mislead, and several modern adjustments to the way they are calculated and displayed have not yet caught up with the way most viewers read them.

The story behind England’s 2024 home summer is instructive here. The ECB’s annual accounts for that year noted that attendance of 2.84 million represented the best ever attendance for a non-Ashes or India year, despite the competing summer of Paris Olympics and football Euros. Engagement with the cricket was real. But for the audience walking through the gates, the batting statistics they saw on the scoreboard often hid as much as they revealed. The three core numbers are useful, but they are not the full story — and the gap between what they show and what they actually measure is worth understanding.

How Batting Average Is Calculated
The batting average is the simplest of the three numbers in its formula and the most misleading in its interpretation. It is calculated by dividing the total runs scored by the number of times the batter has been dismissed — not the number of innings played. A batter who has scored 1,000 runs across 25 innings, of which they were dismissed 20 times and not out 5 times, has an average of 50.
The “not dismissed” denominator is the source of most of the confusion around batting average. The calculation treats a not-out innings as incomplete — the batter could have scored more if not for the innings ending — and so it does not count those innings against the divisor. The intuition behind this is reasonable. A batter who finishes 80 not out has not been bowled at; they have not produced a complete innings; treating that as equivalent to a 20-ball collapse would penalise the batter for circumstances outside their control.

The problem is that batters who play late in the order accumulate not-outs at a higher rate than those who open the innings. A number-six batter who runs out of partners at the tail will frequently finish on 30 or 40 not out, never fully tested. Those innings inflate the average without contributing the runs you would expect from the headline number. A top-order batter who plays 25 innings with only one not-out has a much “harder” average than a lower-order batter with the same number who has been not-out eight times.
The other distortion is format-specific. A Test average sits in a different scale from a T20 average, which sits in a different scale from a Hundred or ODI average. A Test batting average of 50 is exceptional; a T20 average of 50 means very little because batters in T20 cricket are dismissed less frequently per innings due to the shorter format. The same number across formats does not mean the same thing.
Strike Rate Across Formats
The strike rate corrects for one of the average’s weaknesses by measuring how quickly a batter scores rather than how much. It is calculated as runs scored per 100 balls faced. A batter who has scored 1,000 runs from 1,500 balls has a strike rate of 66.67.
The strike rate’s meaning changes radically across formats. In Test cricket, a strike rate of 60 is healthy; a strike rate above 70 is aggressive; a strike rate above 80 is exceptional and usually reserved for the most attacking players. In T20 cricket, a strike rate of 60 is a millstone — the batter is failing to score quickly enough to threaten a competitive total. A T20 strike rate of 140 is the modern baseline for an effective middle-order batter, with the best openers and finishers pushing 150 to 170 across full seasons.

The Hundred uses the same strike-rate convention as T20 — runs per 100 balls — which makes Hundred strike rates directly comparable to T20 numbers. The 100-ball innings produces strike rates that look a lot like T20 strike rates, and the broadcast graphics rarely need to convert between the two formats.
What strike rate hides is the situation in which the runs were scored. A T20 batter with a strike rate of 150 who scored most of those runs in the death overs against tired bowlers and short boundaries has produced a different innings from a batter with the same strike rate who scored against the new ball under pressure in the powerplay. The number is identical but the underlying performance is not. Modern broadcasters increasingly show strike rate broken down by phase (powerplay, middle overs, death) to address this gap, but the headline number on the scorecard still treats all balls equally.
Why Not-Out Innings Distort the Picture
The not-out distortion affects different batters in different ways, and it is worth thinking about who benefits and who is penalised by the convention. The clearest beneficiaries are middle and lower-order batters who frequently run out of partners or finish innings with the team total reached. Their innings are cut short by external events rather than by their dismissal, and the average treats those innings as more impressive than they sometimes are.
The clearest victims are openers and top-order batters, who almost never accumulate not-out innings because they bat against the new ball and rarely survive an entire innings. A top-order batter with a Test average of 45 has been tested far more rigorously than a number-eight batter with the same average who finishes 30 not out every other innings. The two numbers look identical on the scorecard but represent fundamentally different careers.
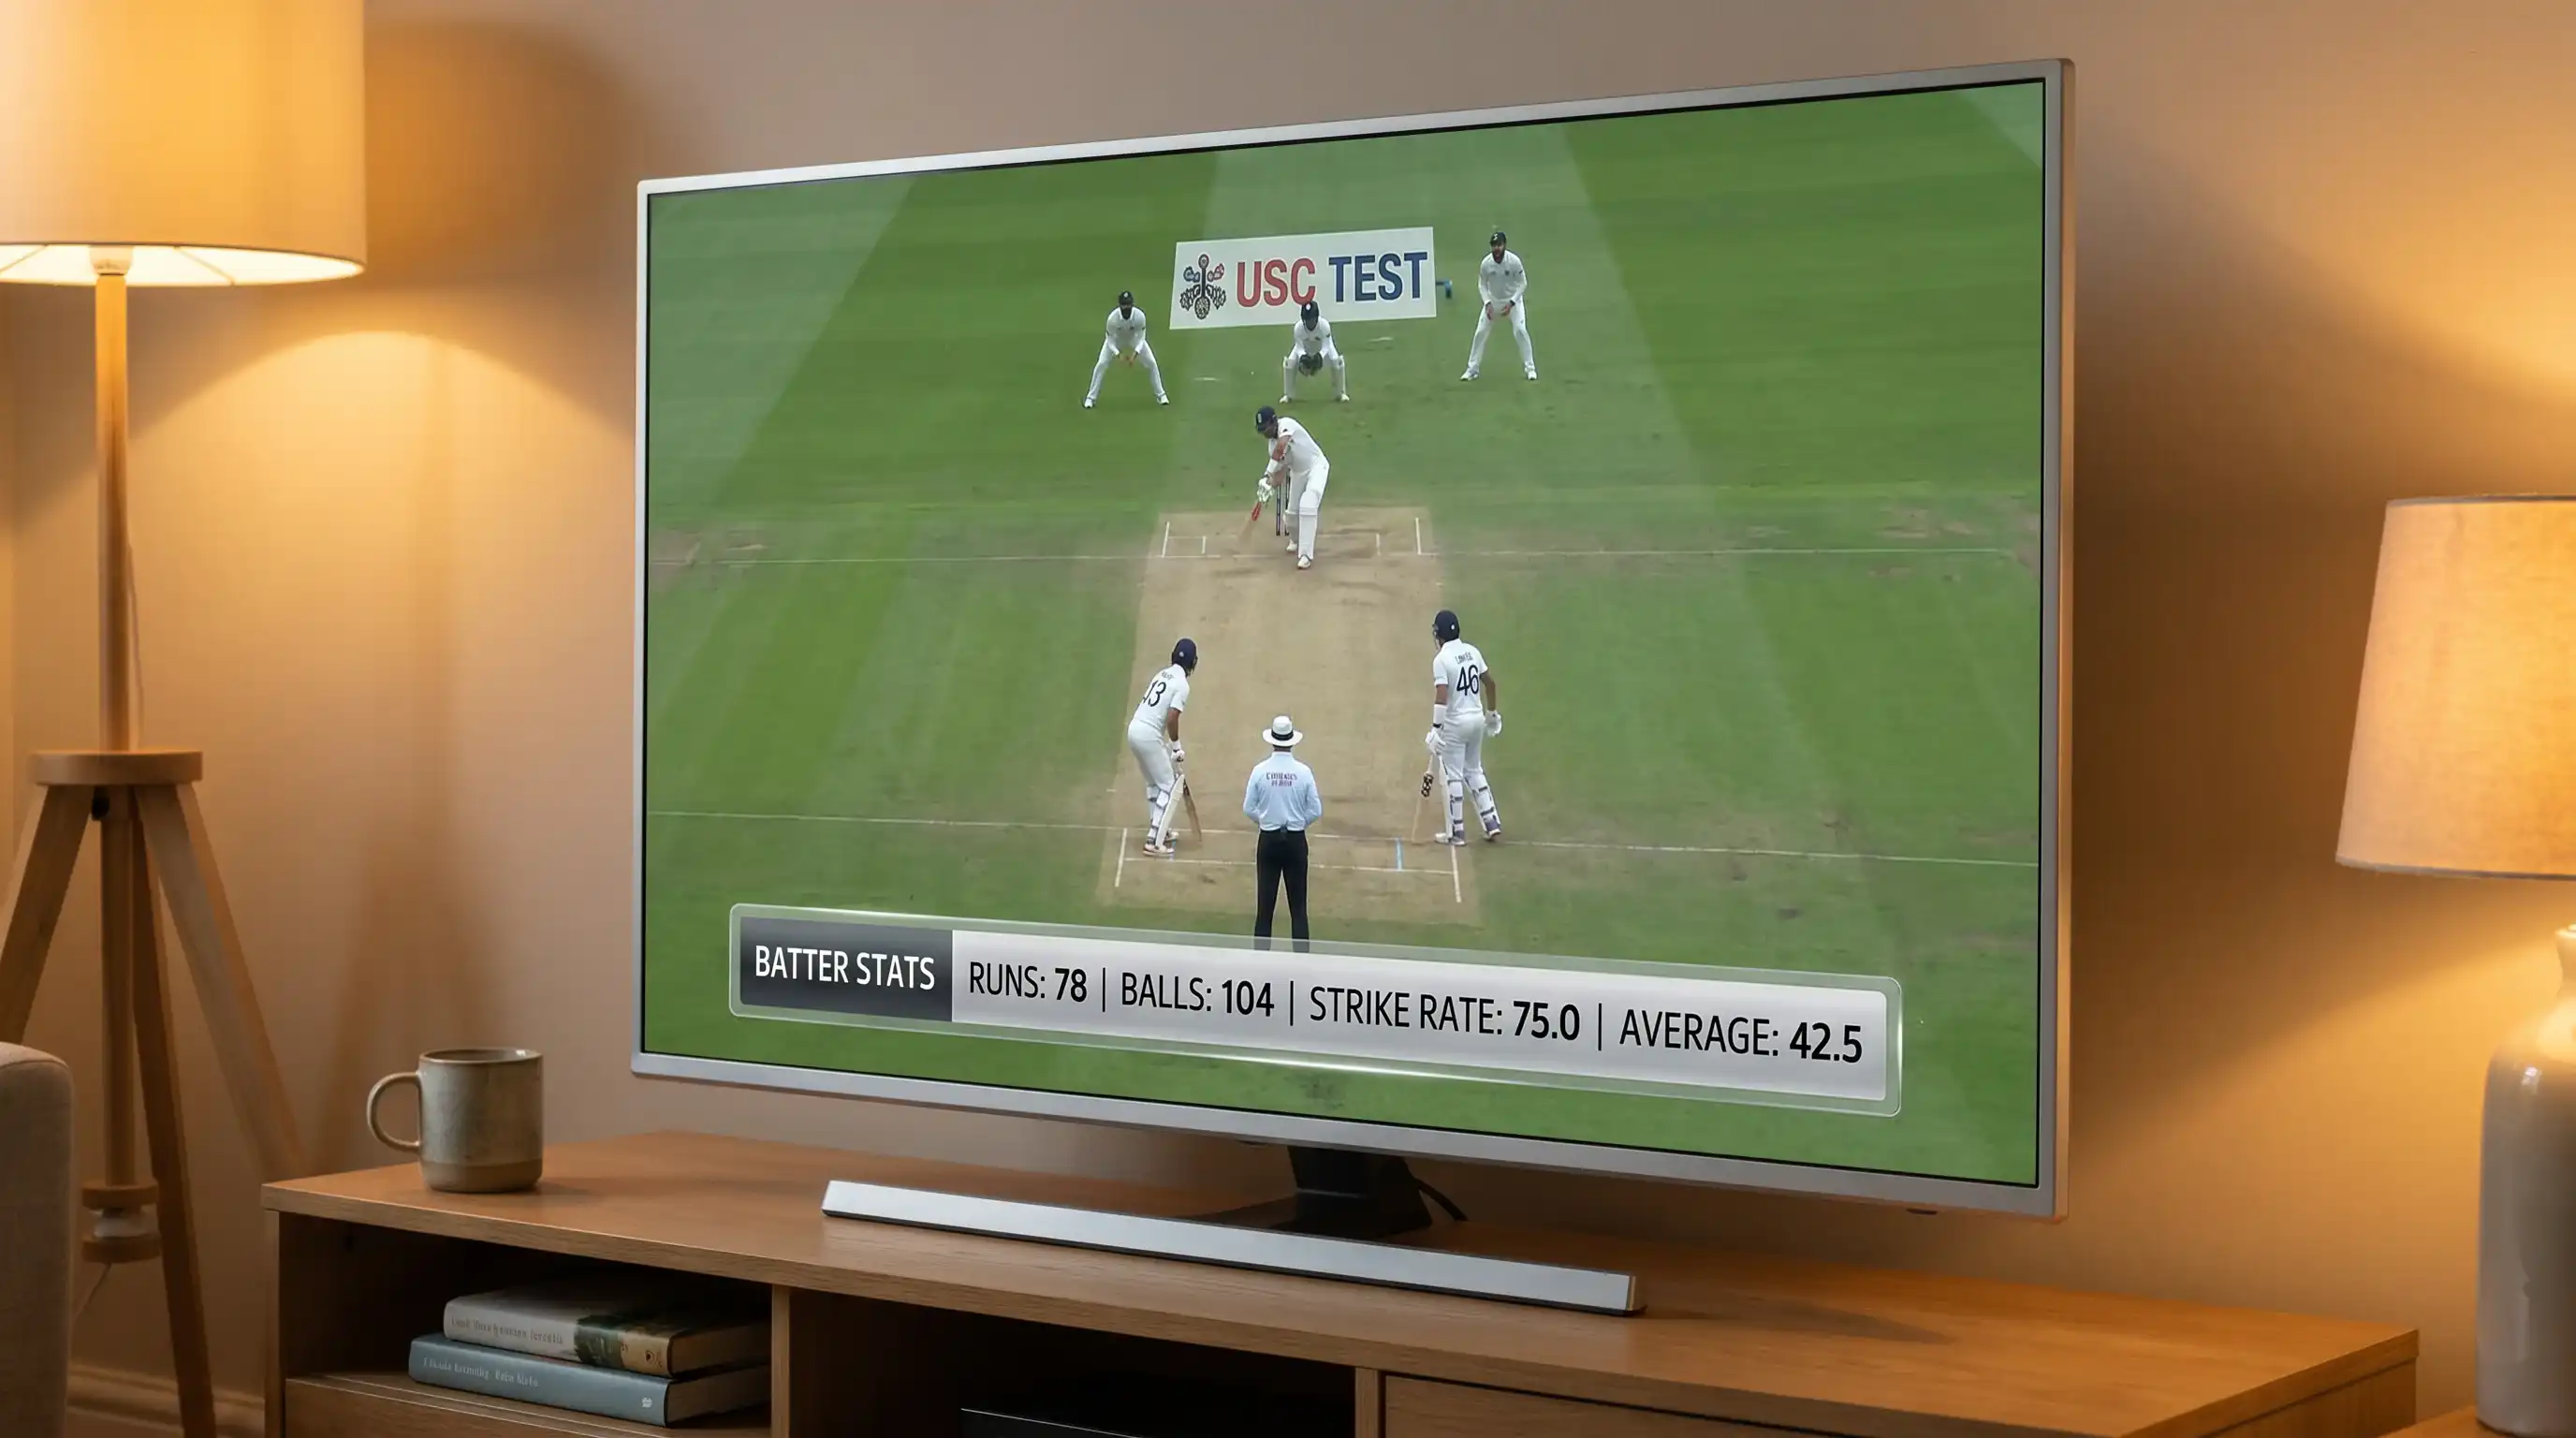
The DRS figures provide a useful side-light here. DRS reviews fall behind around 15 percent of Test wickets in modern cricket, meaning the technology decides a meaningful number of dismissals — and those dismissals feed directly into the batting average’s denominator. A batter who survives a marginal LBW review keeps batting; a batter who is given out by the technology adds another dismissal to the divisor. The technology’s role in shaping averages is significant even though it is rarely discussed in those terms.
The 2024 County Championship’s shift toward spin — with spin bowlers delivering around 37 percent of overs (1,035 from a total) compared to 17 percent the previous year (767 overs) — also affects the not-out distortion at first-class level. Spin-heavy innings produce different dismissal patterns, with more bat-pad catches and stumpings, and fewer of the tail-end dismissals that produce not-outs for the upper middle order.
Context-Adjusted Stats Now Appearing on Live Feeds
The newer wave of cricket statistics tries to address the gaps that average and strike rate leave open. Context-adjusted stats appear on most modern scoreboards in some form, particularly in T20 and Hundred coverage where the format’s brevity makes the standard averages less useful.
Phase-adjusted strike rates break down the batter’s scoring rate by powerplay, middle overs, and death overs. The number reveals which phase a batter is most effective in — a high middle-overs strike rate suggests a batter who can rotate strike against spin; a high death-overs rate suggests a finisher who can score boundaries against yorkers and slower balls.

Boundary percentage — the proportion of runs scored from fours and sixes versus from singles and twos — is another modern stat that reveals what the headline numbers hide. A batter with a strike rate of 140 might be reaching that figure through a high boundary percentage (lots of fours and sixes, fewer balls faced) or through fast strike rotation (lots of singles and twos, lower boundary count). The two approaches require different bowling responses and produce different match situations.
Pressure-adjusted averages — calculated against the match situation, the opposition’s bowling strength, and the pitch conditions — are starting to appear on advanced cricket analytics platforms, though they have not yet made it into mainstream scoreboards. The intuition behind them is that scoring 50 against a strong attack on a difficult pitch is worth more than 50 against a weaker attack on a flat surface, and the statistics should reflect that. The implementation is contested, and different platforms use different formulae, but the direction of travel is clear.
If you want a closer look at how all of these statistics tie into the rest of the scorecard, there is more on that in our scorecard reading guide.
Written by the editors at Stumply.
