
The DLS Method Explained: How Rain Rewrites a Cricket Target
 Available in US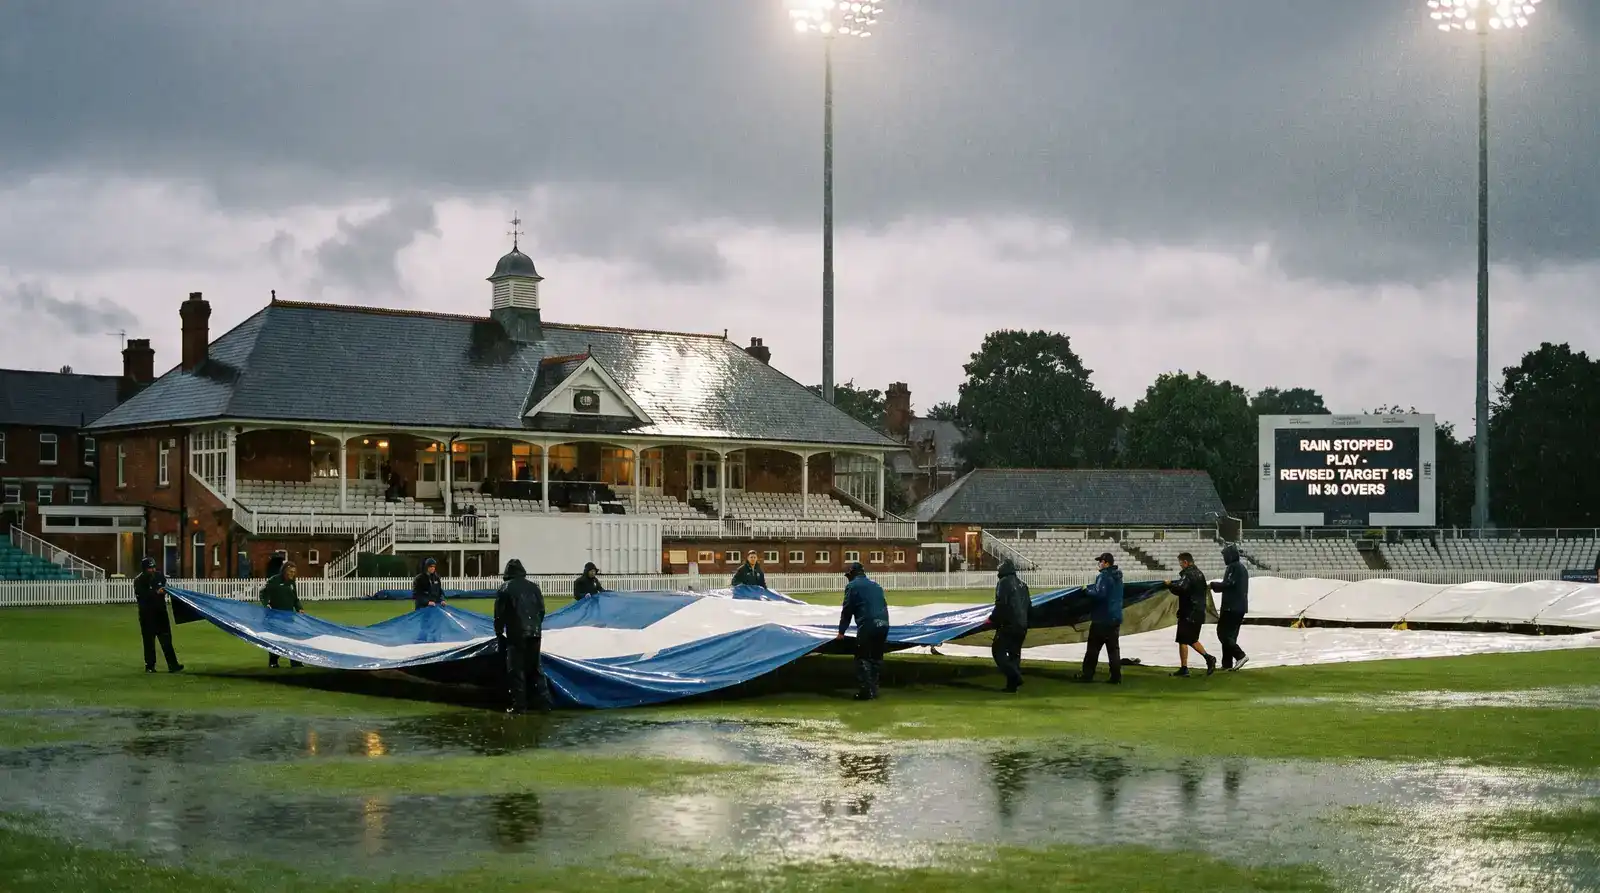
What the DLS Method Actually Does to a Run Chase
The first time I saw a rain delay revise a target downward and watched the chasing team still look gutted, I knew the DLS Method needed better translation for the average viewer. The chasing side had been ten runs ahead on the run rate. The revised target left them eight runs behind on what the system calls “par”. They had not lost the game in any traditional sense — they had lost a calculation they could not see in real time.
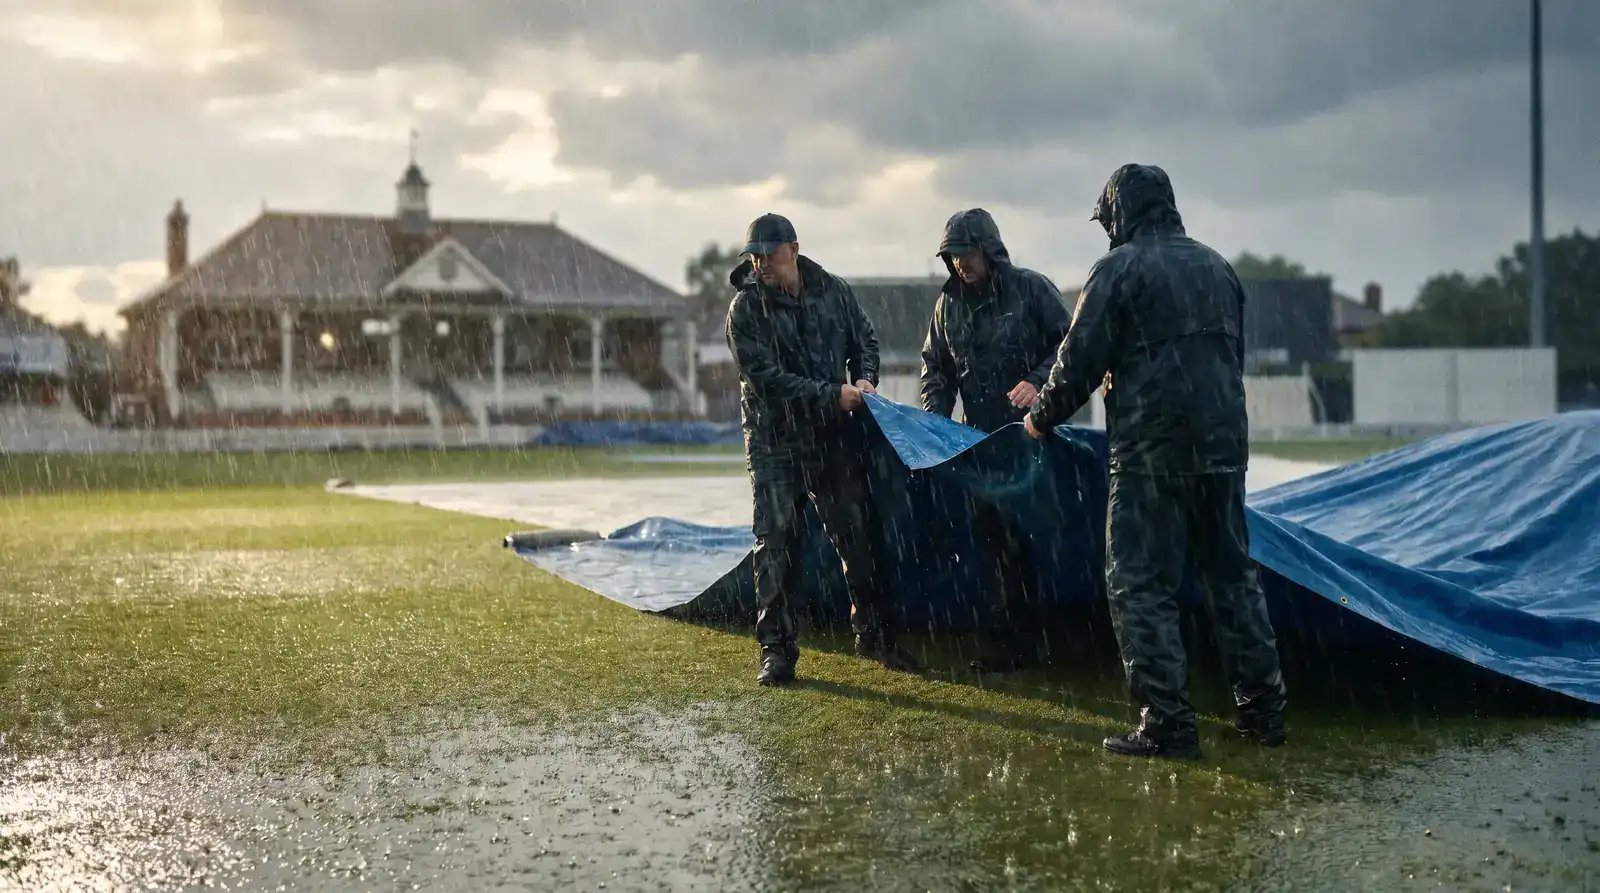
DLS is a method for adjusting cricket targets when weather interrupts a limited-overs match. It does not care about run rate in isolation. It cares about resources — how many overs and how many wickets each team had available when the game stopped. That distinction is the whole point. If you skip it, the rest of the system looks arbitrary. If you grasp it, the revised targets stop feeling random.
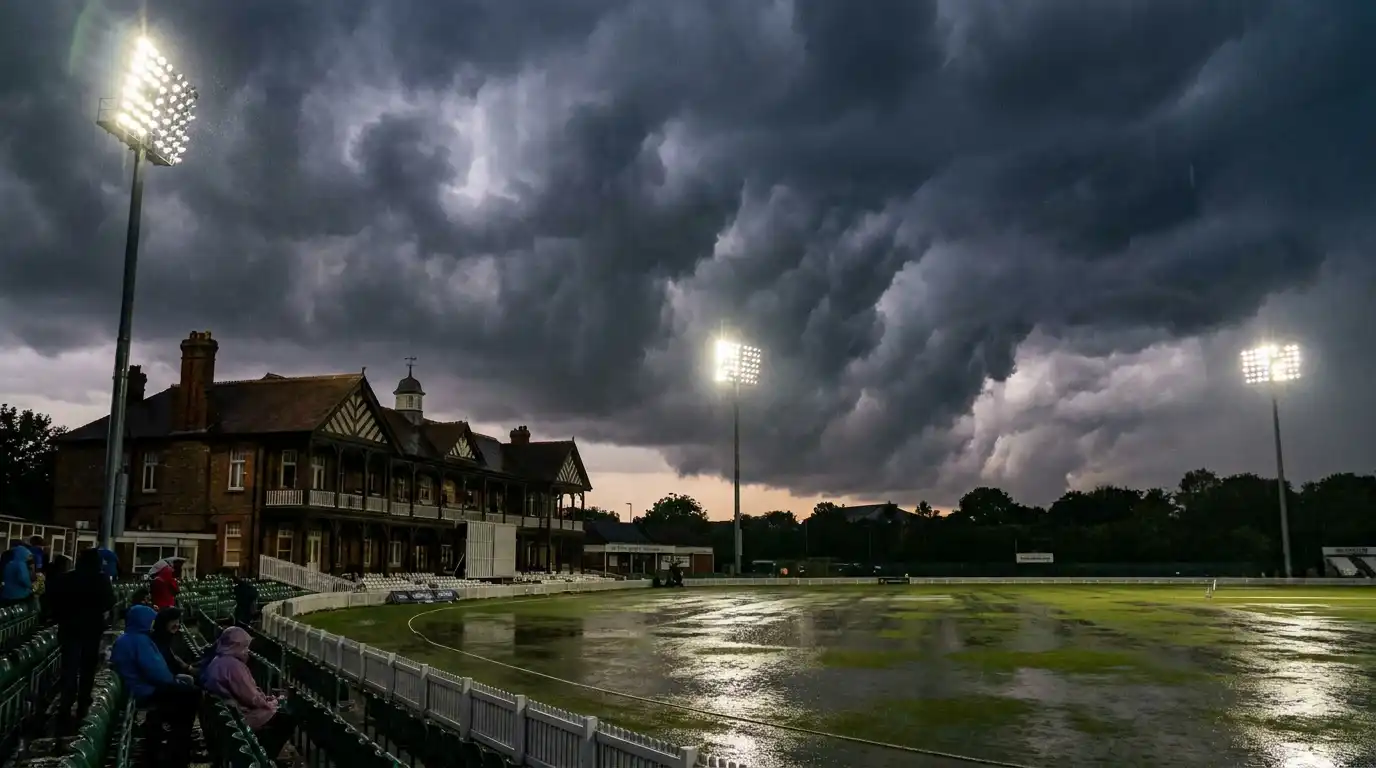
Across UK summer cricket, DLS comes into play at least once or twice during an average season at the international level, and far more often in The Hundred and county white-ball cricket where afternoon showers are part of the rhythm. Knowing how to read the revised target on a live scorecard saves a lot of confused texts to friends asking why the chase suddenly looks easier or harder than the scoreline suggests.
From Duckworth-Lewis to Stern: A Short Origin Story
The pre-DL world was a mess. The old “average run rate” method asked the chasing team to match the rate the first side had scored at, which sounded fair until you remembered that the first side had wickets in hand for the full innings. Even worse, the “most productive overs” method used at the 1992 World Cup gave South Africa a revised target of 22 runs from one ball after a rain delay — an outcome that became one of cricket’s most-quoted absurdities.
Frank Duckworth and Tony Lewis, both English statisticians, sat down in the mid-1990s with a different question: how do you actually measure what a batting side has left to give? Their answer was a resource table. Two variables, overs remaining and wickets in hand, combined to produce a single number representing the proportion of innings still available. Pair the resource percentages of both sides, and you have a fair comparison.
The Duckworth-Lewis method was adopted by the ICC in 1999 and used for two decades. Then Steven Stern, an Australian statistician, took over maintenance of the table in 2014 after Duckworth and Lewis retired. He rebuilt the underlying model to account for the higher scoring of modern T20 and ODI cricket. The system became DLS in 2014 to reflect his contribution. Stern’s update was not cosmetic — it changed how T20 chases get recalculated, particularly when only a few overs are lost.
What stayed the same was the basic idea. Resources, not run rate, drive the calculation. That has been the spine of every weather-revised target since.
Resources, Not Just Overs: The Core Idea
Here is the bit that catches most viewers. When two teams play a 50-over match and rain reduces it to 30 overs each, the chasing team does not simply chase the first team’s runs scaled to 30 overs. They chase a target based on the resources both teams had when they batted.
A resource percentage starts at 100 percent at the top of a full innings. Lose an over, lose a slice of percentage. Lose a wicket, lose a different slice. The table — published by the ICC and updated periodically — quantifies both losses. The early wickets cost more resource than the later ones, because the loss of an opener affects the rest of the innings more than the loss of the tail.
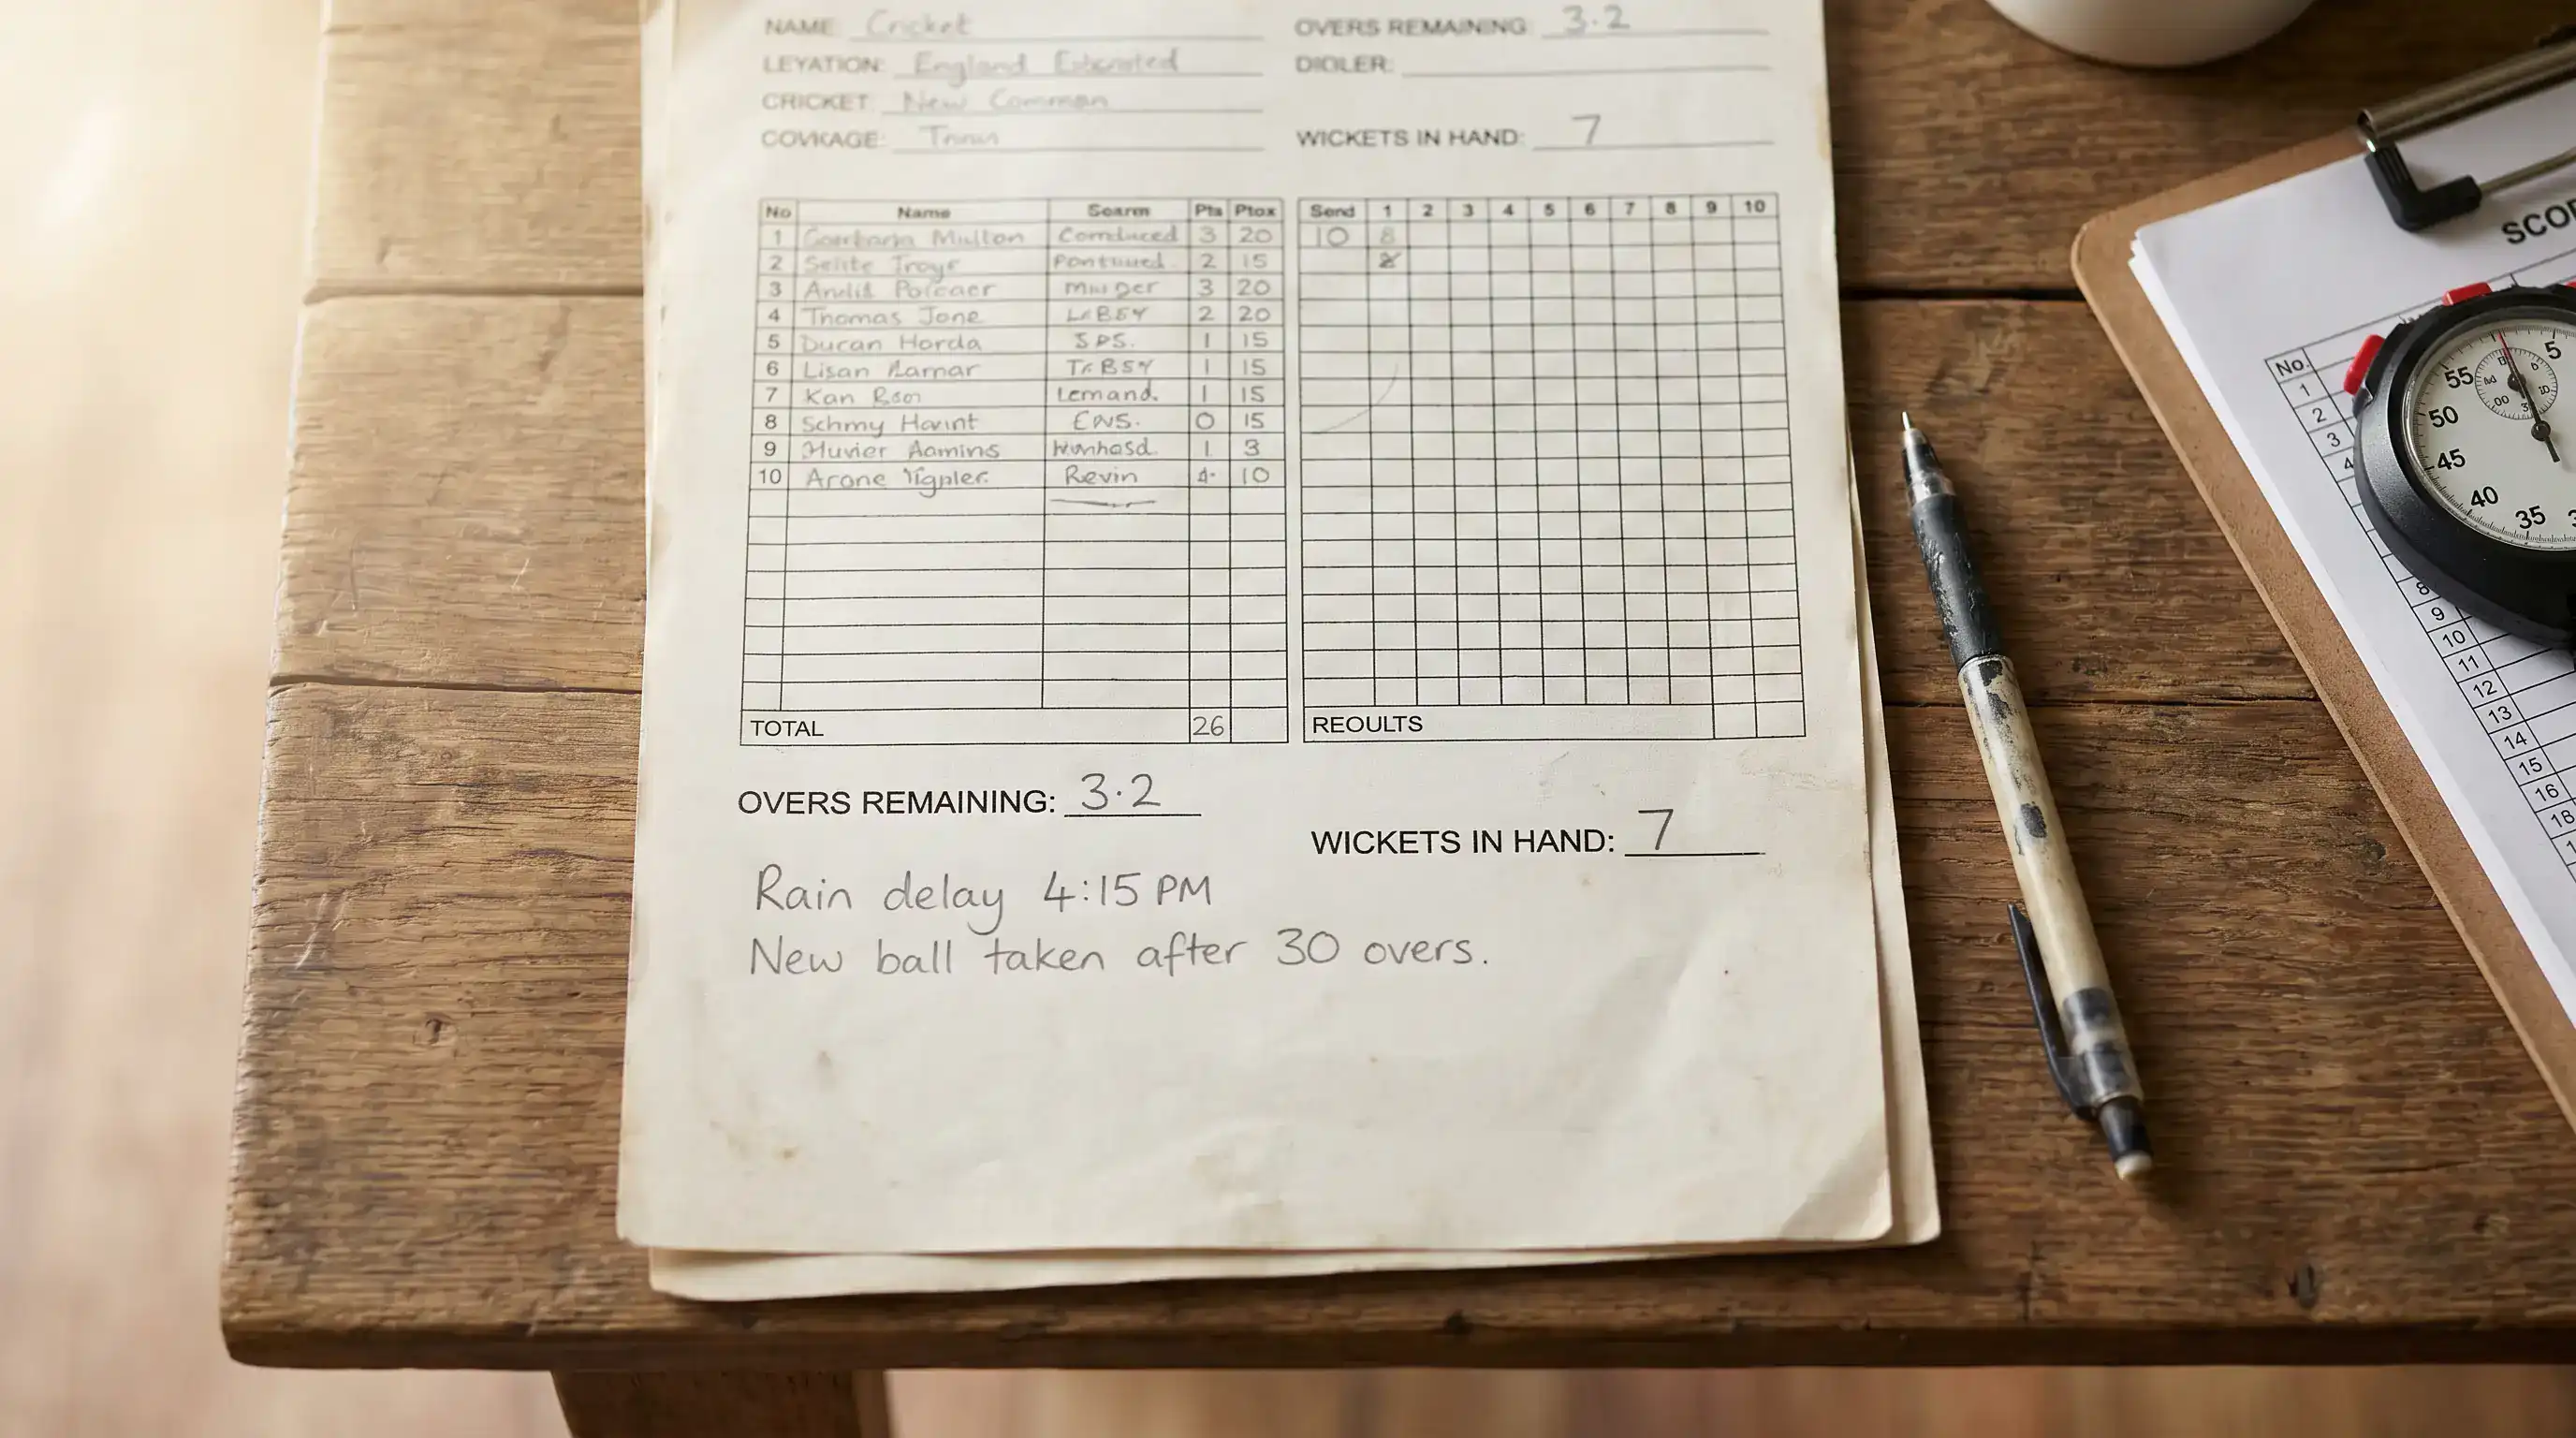
The maths then becomes straightforward in principle. Calculate the resources Team 1 used. Calculate the resources Team 2 has. If the resources are equal, the target is the score Team 1 made. If Team 2 has more resources, the target is scaled up. If they have less, it is scaled down. The DLS formula does this in seconds, and the broadcasters show the revised target before the players have left the field.
I find it useful to think of it like this. Run rate measures a sprint. DLS measures the energy still in the tank. A team chasing 180 in 20 overs is in a different position depending on whether they have nine wickets in hand or three. Run rate does not see that. DLS does.
What “DLS Par” on a Live Scorecard Means
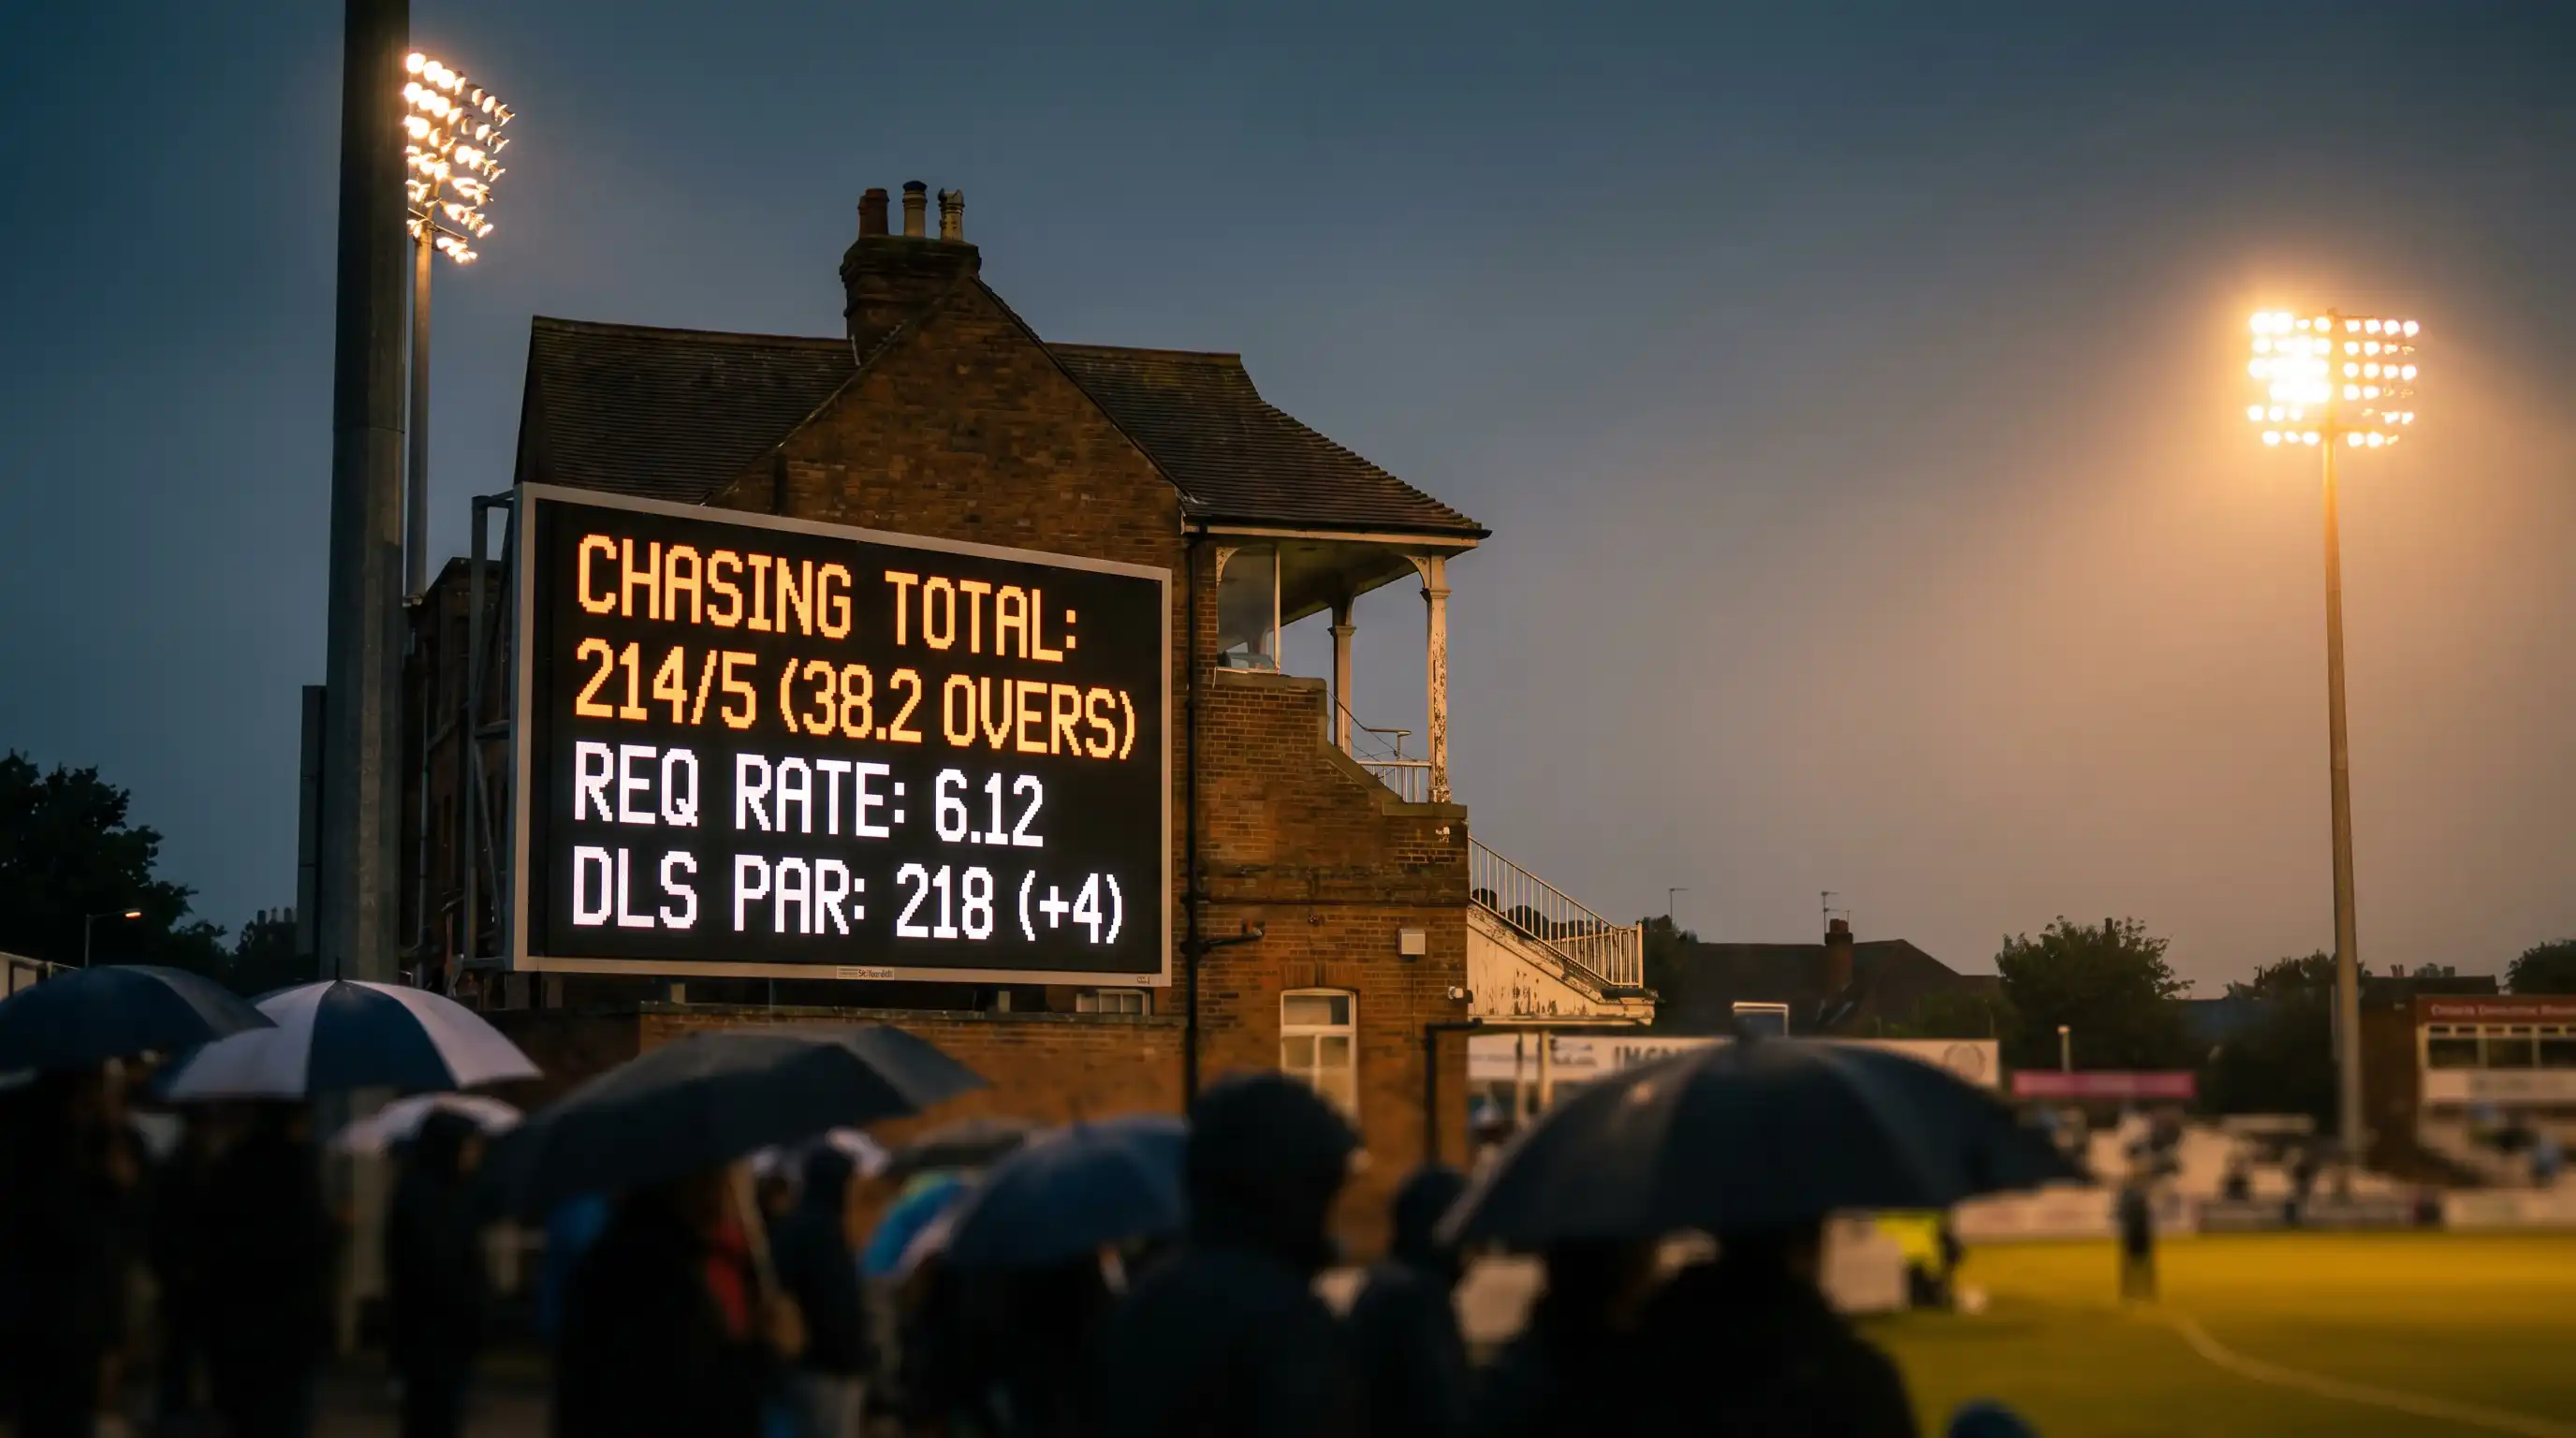
Modern live scorecards in the UK show two key numbers during a rain-affected chase: the current score and the DLS par. Par is the score the chasing team needs to be ahead of, at this exact moment, to be ahead in the match if rain ends the innings now.
This is not a forecast. It is a snapshot. If the par at the end of the 12th over is 85 and the chasing team is on 91, they are six runs ahead on DLS. If the heavens open in the next minute and the match is abandoned, the chasing team wins. If they are on 80, they lose by five runs. The current run rate is irrelevant to that judgement.
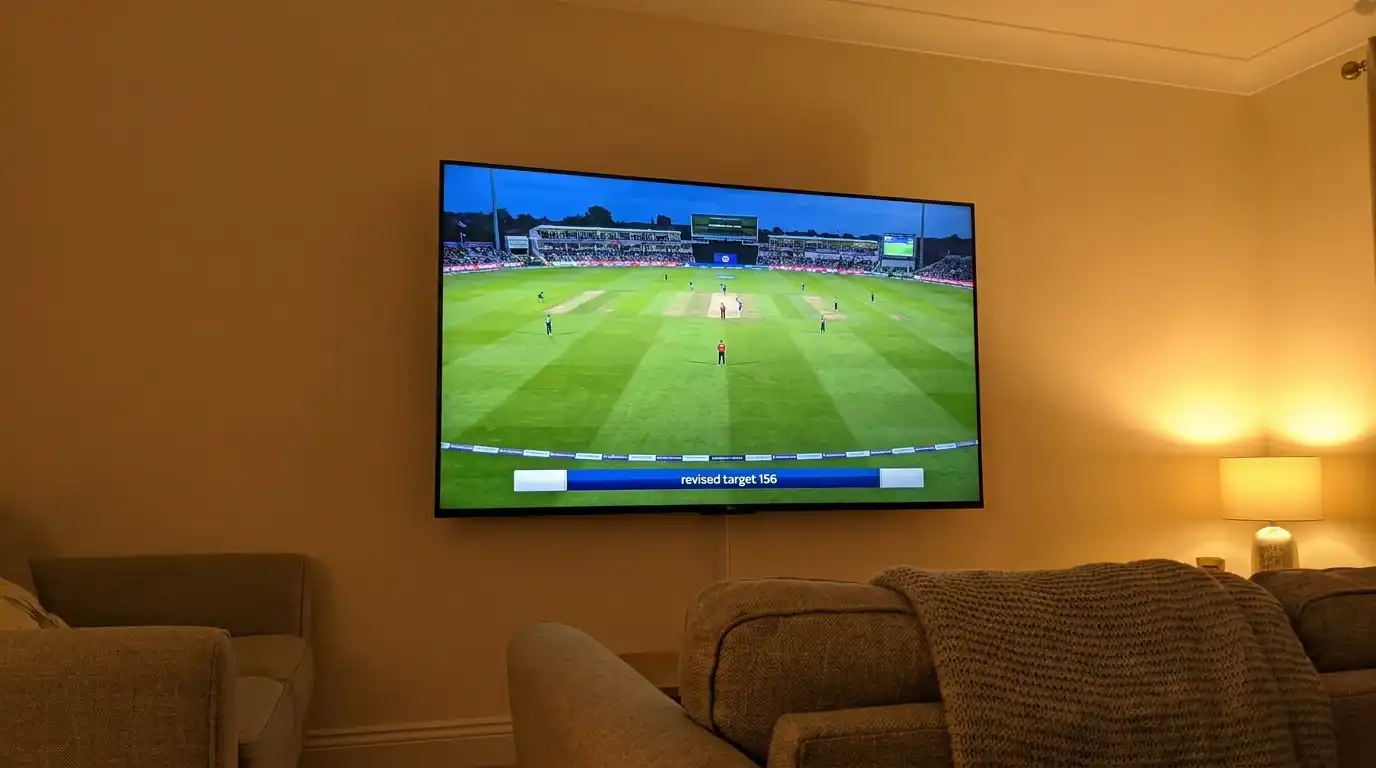
I find the par score the single most useful thing on a UK scorecard during a wet summer. It tells you exactly what the team needs to do to survive a delay, and it updates after every ball. In Test cricket, the equivalent of par does not exist because the match is not on a strict resource clock. In T20 and the white-ball county cup, par is the number to watch when the clouds start gathering.
Hawk-Eye and ball-tracking generate plenty of headlines, but the DLS par score is the more practical piece of in-game maths, and it shapes every decision the batting side makes — when to accelerate, when to consolidate, when to take risks against a particular bowler. The Hawk-Eye inventor Paul Hawkins once put it well when explaining why technology earned its place in cricket: even the smallest edge gets detected. The same principle applies here. Even a single over of rain shifts the par by a measurable amount, and the chasing side knows it.
The same scorecard mechanics that produce par feed into the broader live picture, and they sit alongside the broadcaster’s other graphics. If you want the wider context on what a live scorecard contains and how all these data layers stack up, I have written more on that in the officiating technology guide.
Where DLS Falls Short and How Stern Patched It
The original Duckworth-Lewis worked beautifully for ODI cricket of the late 1990s, when a 250 was a competitive score. It worked less well as scoring rates climbed. By the early 2010s, top sides were chasing 350 in 50 overs and producing par scores that did not match what the chasing team could realistically achieve.
The issue was that the resource table assumed a relatively flat scoring curve across the innings. Modern T20 cricket smashes that assumption. The death overs in T20 frequently produce four or five times the run rate of the powerplay. The old table did not weight that steeply enough, which is why chases in T20 sometimes produced absurd-looking targets when rain hit late.
Stern’s contribution was to rebuild the table using data from the modern era. He kept the resource framework but reshaped the curve to reflect the way top-order, middle-order, and death-overs scoring actually diverged. That is what made DLS legitimate for T20 and what kept it credible as the format kept getting more aggressive.
The system still has its critics. Some statisticians argue that the resource table is updated too slowly, that it lags the actual scoring patterns by two or three years. Others argue that DLS underweights the value of wickets in T20 — that nine wickets in hand for the final four overs is worth more than the table suggests. These are real debates, not amateur grumbles.
What I tell anyone who asks me about DLS is this: it is the best system cricket has, and it has been better than the alternative for nearly thirty years. Until something replaces it, the par score on the scoreboard is the verdict the match officials and players are working from. Trust the number, even when the rain feels unfair.
Created by the "Stumply" editorial team.
