
Bowling Economy Rate: The Number That Decides Which Bowler Comes On Next
 Available in US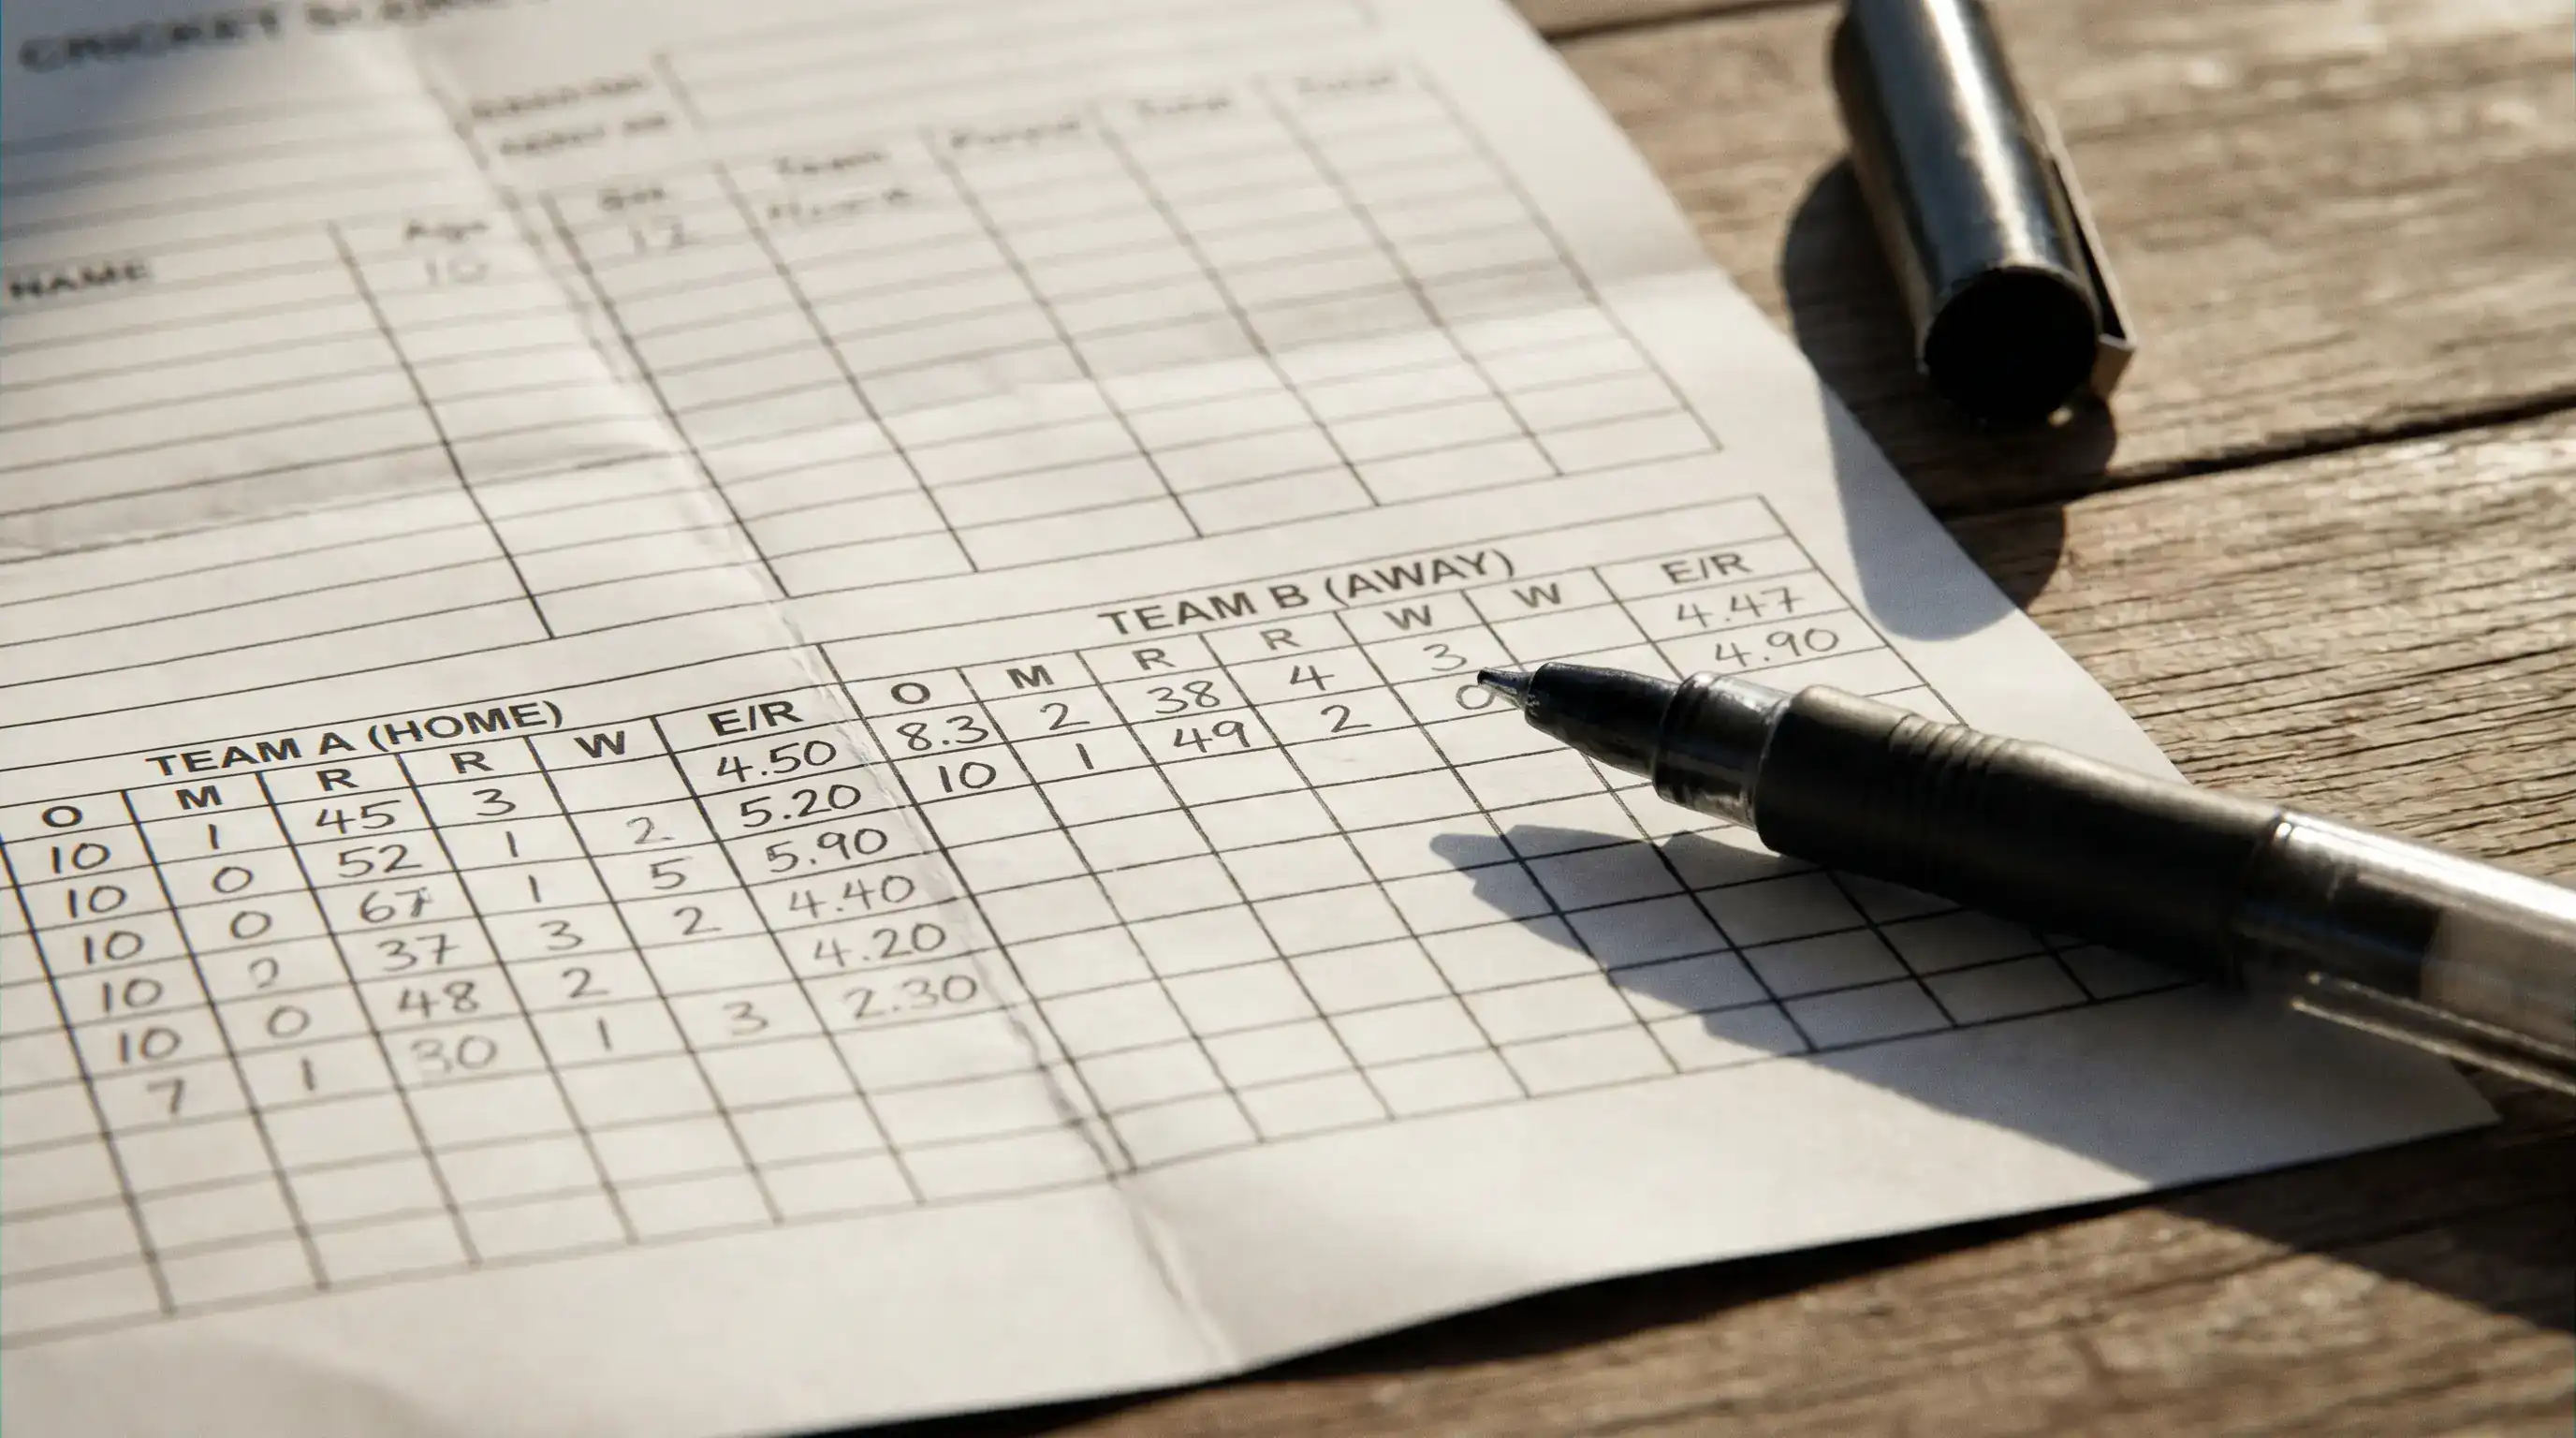
The Single Stat That Drives Captains’ Decisions
Watching a limited-overs match from the captaincy perspective is a useful exercise. The captain is looking at one number more than any other: the economy rate of each bowler still available to bowl. Wickets matter, of course. But in a chase, the question of who bowls the next over is overwhelmingly answered by which bowler is currently conceding the fewest runs per six balls. Economy rate is the live indicator of how the bowling resource is being managed, and it tells you more about white-ball cricket strategy than any other single statistic.

This is what the number actually measures, the format-specific benchmarks, and the ways in which it interacts with the other bowling figures on the scorecard.
The Calculation and Its Quirks
Economy rate is runs conceded divided by overs bowled. A bowler who has bowled 4 overs and conceded 24 runs has an economy of 6. A bowler with 10 overs and 40 runs has an economy of 4.
The calculation has one quirk that catches casual viewers. When a bowler has bowled a partial over, the overs count uses decimal notation where the digits after the point represent balls, not tenths. A bowler with figures of 3.4 overs has bowled 3 complete overs and 4 balls — that is 22 balls total, not 22 balls converted to “3.67 overs”. The economy rate calculation has to convert this back to a proper decimal: 22 balls divided by 6 balls per over equals 3.667 overs, and the runs divided by that figure gives the economy.

Broadcast graphics handle this automatically. If you are doing the maths yourself from the scorecard, the trap is treating 3.4 overs as 3.4 in the calculation rather than 3.667. The error is small but consistent, and once you know it is there you stop making it.
Format Benchmarks
The benchmarks for what counts as a good economy rate differ by format more dramatically than almost any other statistic.
In Test cricket, an economy rate of 3 is excellent, 3.5 is good, and 4-plus is starting to look expensive. The format rewards bowlers who can string together maiden overs and force defensive shots from the batter, and the economy rate over a five-day match tends to settle lower than in any limited-overs format. A spinner bowling tight lines on a turning fifth-day pitch can hold an economy below 2.5.
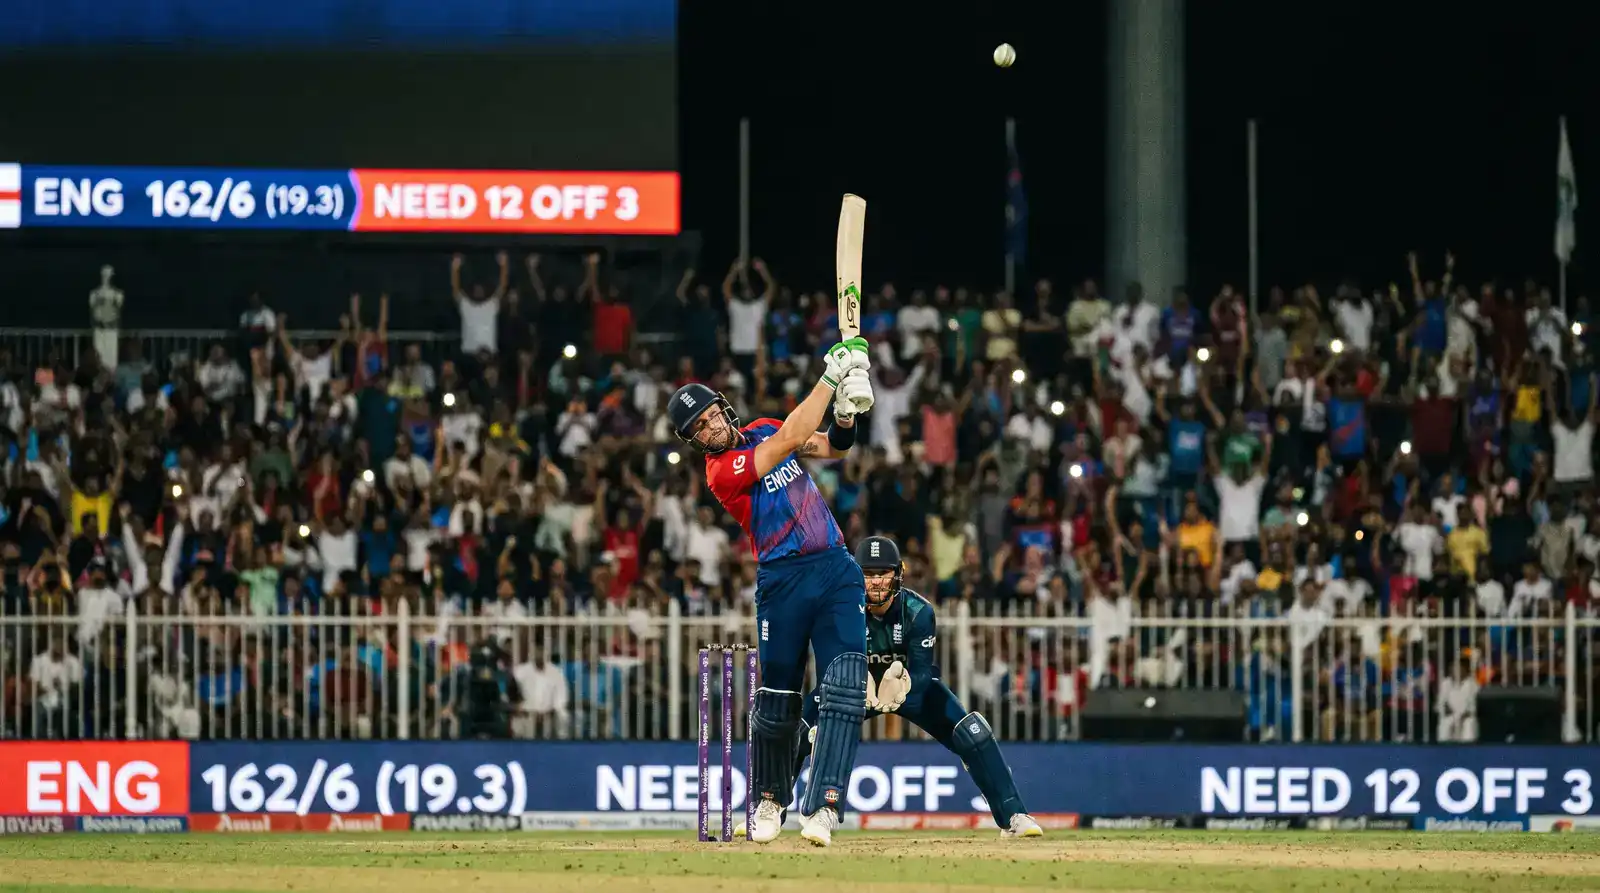
In ODI cricket, the benchmarks rise. An economy of 5 is good, 5.5 is competitive, and anything below 4.5 is exceptional. The bowling powerplay and the closing-overs death make the numbers volatile within a single spell — a bowler can have an economy of 3 after 4 overs and 7 after their full 10 if they bowl their last 6 at the death.
In T20 cricket, the benchmarks rise further. An economy of 7 is good, 8 is competitive, and below 6 is excellent. A T20 spell rarely lasts more than 4 overs, which means a single expensive over can push the economy up significantly. A bowler who concedes 18 runs in one over and 24 in the other three has an economy of 10.5 — not because they bowled badly across the spell, but because one over went badly.
In the Hundred, the benchmarks are normalised to runs per five-ball set rather than per six-ball over. A set conceding 5 runs is roughly the equivalent of an over conceding 6, which is a T20 economy of 6 — strong but not exceptional. The format’s strike-rate-equivalent for bowlers is the per-set economy, and the conversion to traditional economy rate is straightforward: runs per set divided by five, multiplied by six. A set economy of 5 converts to a traditional economy of 6.
What the Captain Is Reading
The captain in a limited-overs chase is reading economy rates as live data, updated after every over. The decision tree is straightforward: the bowler with the lowest current economy gets the next over, subject to a few constraints. Those constraints are which end the captain wants the bowler at, whether the match-up against the current batter favours that bowler, whether the bowler has overs left in their allocation, and whether the bowler is showing physical signs of being out of rhythm.
The over allocation constraint is the most important in limited-overs cricket. In ODIs, no bowler can bowl more than 10 of the 50 overs. In T20s, no bowler can bowl more than 4 of the 20. In the Hundred, no bowler can bowl more than 20 of the 100 balls — which is 4 five-ball sets. The captain has to manage the economy of each bowler across the full innings, not just the current over.

This is where the captain’s judgement gets tested. A captain who bowls his lowest-economy bowler out by the 15th over has nothing left when the death overs arrive. A captain who saves his best bowler for the death may find the chasing side has built such a strong base in the middle overs that the death-overs effort is not enough. The economy rate is the input. The decision is when to deploy each bowler within the constraint of their allocation.
The Trap of Economy Rate Without Wickets
A bowler with an economy of 4 in a T20 match looks brilliant on the scorecard. But if that bowler has taken 0 wickets in 4 overs, the bowling side has 16 runs conceded and 0 dismissals, which means the batting side is still 10 wickets in hand and on a base of 16 runs at the end of those 4 overs. A bowler with an economy of 8 who took 3 wickets in 4 overs has conceded 32 runs but removed 3 batters — which usually translates to a slower scoring rate for the remainder of the innings because the new batters need to settle.
The wickets and economy interaction is what the bowling average measures. Bowling average is runs per wicket — total runs conceded divided by total wickets taken. A bowler with an average of 25 has conceded 25 runs for each wicket. In Test cricket, an average below 25 is exceptional. In ODIs, below 30 is competitive. In T20s, the format is short enough that strike rate — balls per wicket — matters more than runs per wicket, and the economy is the dominant metric.

The full set of bowling abbreviations on the scorecard — overs, maidens, runs, wickets, economy — work as a single information block. Reading any one in isolation gives a misleading picture. The fuller picture of how the abbreviations interact is covered in the broader topic of reading a live cricket scorecard, which goes through every column of the bowling and batting tables.
Why Economy Rises at the Death
The death overs in white-ball cricket — typically the last 4 to 5 overs of a T20 innings, or the last 10 of an ODI — produce dramatically higher economy rates than the middle overs. A bowler with an economy of 6 across the first 10 overs of an ODI spell can have an economy of 10 across the last 6 of their allocation. The shift is structural rather than a reflection of the bowler getting worse.
The reason is the batting team’s incentive structure. In the middle overs, the batters are accumulating with low risk because they have wickets in hand and time to make up for any slow patches. In the death overs, the batters are converting wickets in hand into runs at maximum velocity because there is no longer time to wait. The economy rate of the bowling side rises across the innings even if the bowlers themselves are bowling the same lines.

A good death bowler is one whose economy rises less than the average across those overs. A T20 bowler whose economy is 7 across their full 4 overs, when bowled exclusively at the death, is exceptional — the average across the death overs for that match might be 10. The contextual economy — economy relative to the situation in which the overs were bowled — is the better measure of bowling quality at the death than the raw number.
The Spinner-Seamer Difference
Spinners and seamers operate with different economy benchmarks because they are deployed in different phases. A seamer in the powerplay of a T20 is expected to take wickets at the cost of a slightly higher economy. A spinner in the middle overs is expected to choke the scoring with maidens and dot balls.
The 2024 County Championship saw a notable shift in spin usage at the first-class level — Division One produced 1,035 overs of spin bowling, up from 767 the previous year. The economy rates for spinners across that season tightened correspondingly, with several leading spinners holding economies below 2.5 across the season. That is the Test-cricket benchmark, applied to the County Championship where the format and the pitches reward the spinner who can bowl long containing spells.
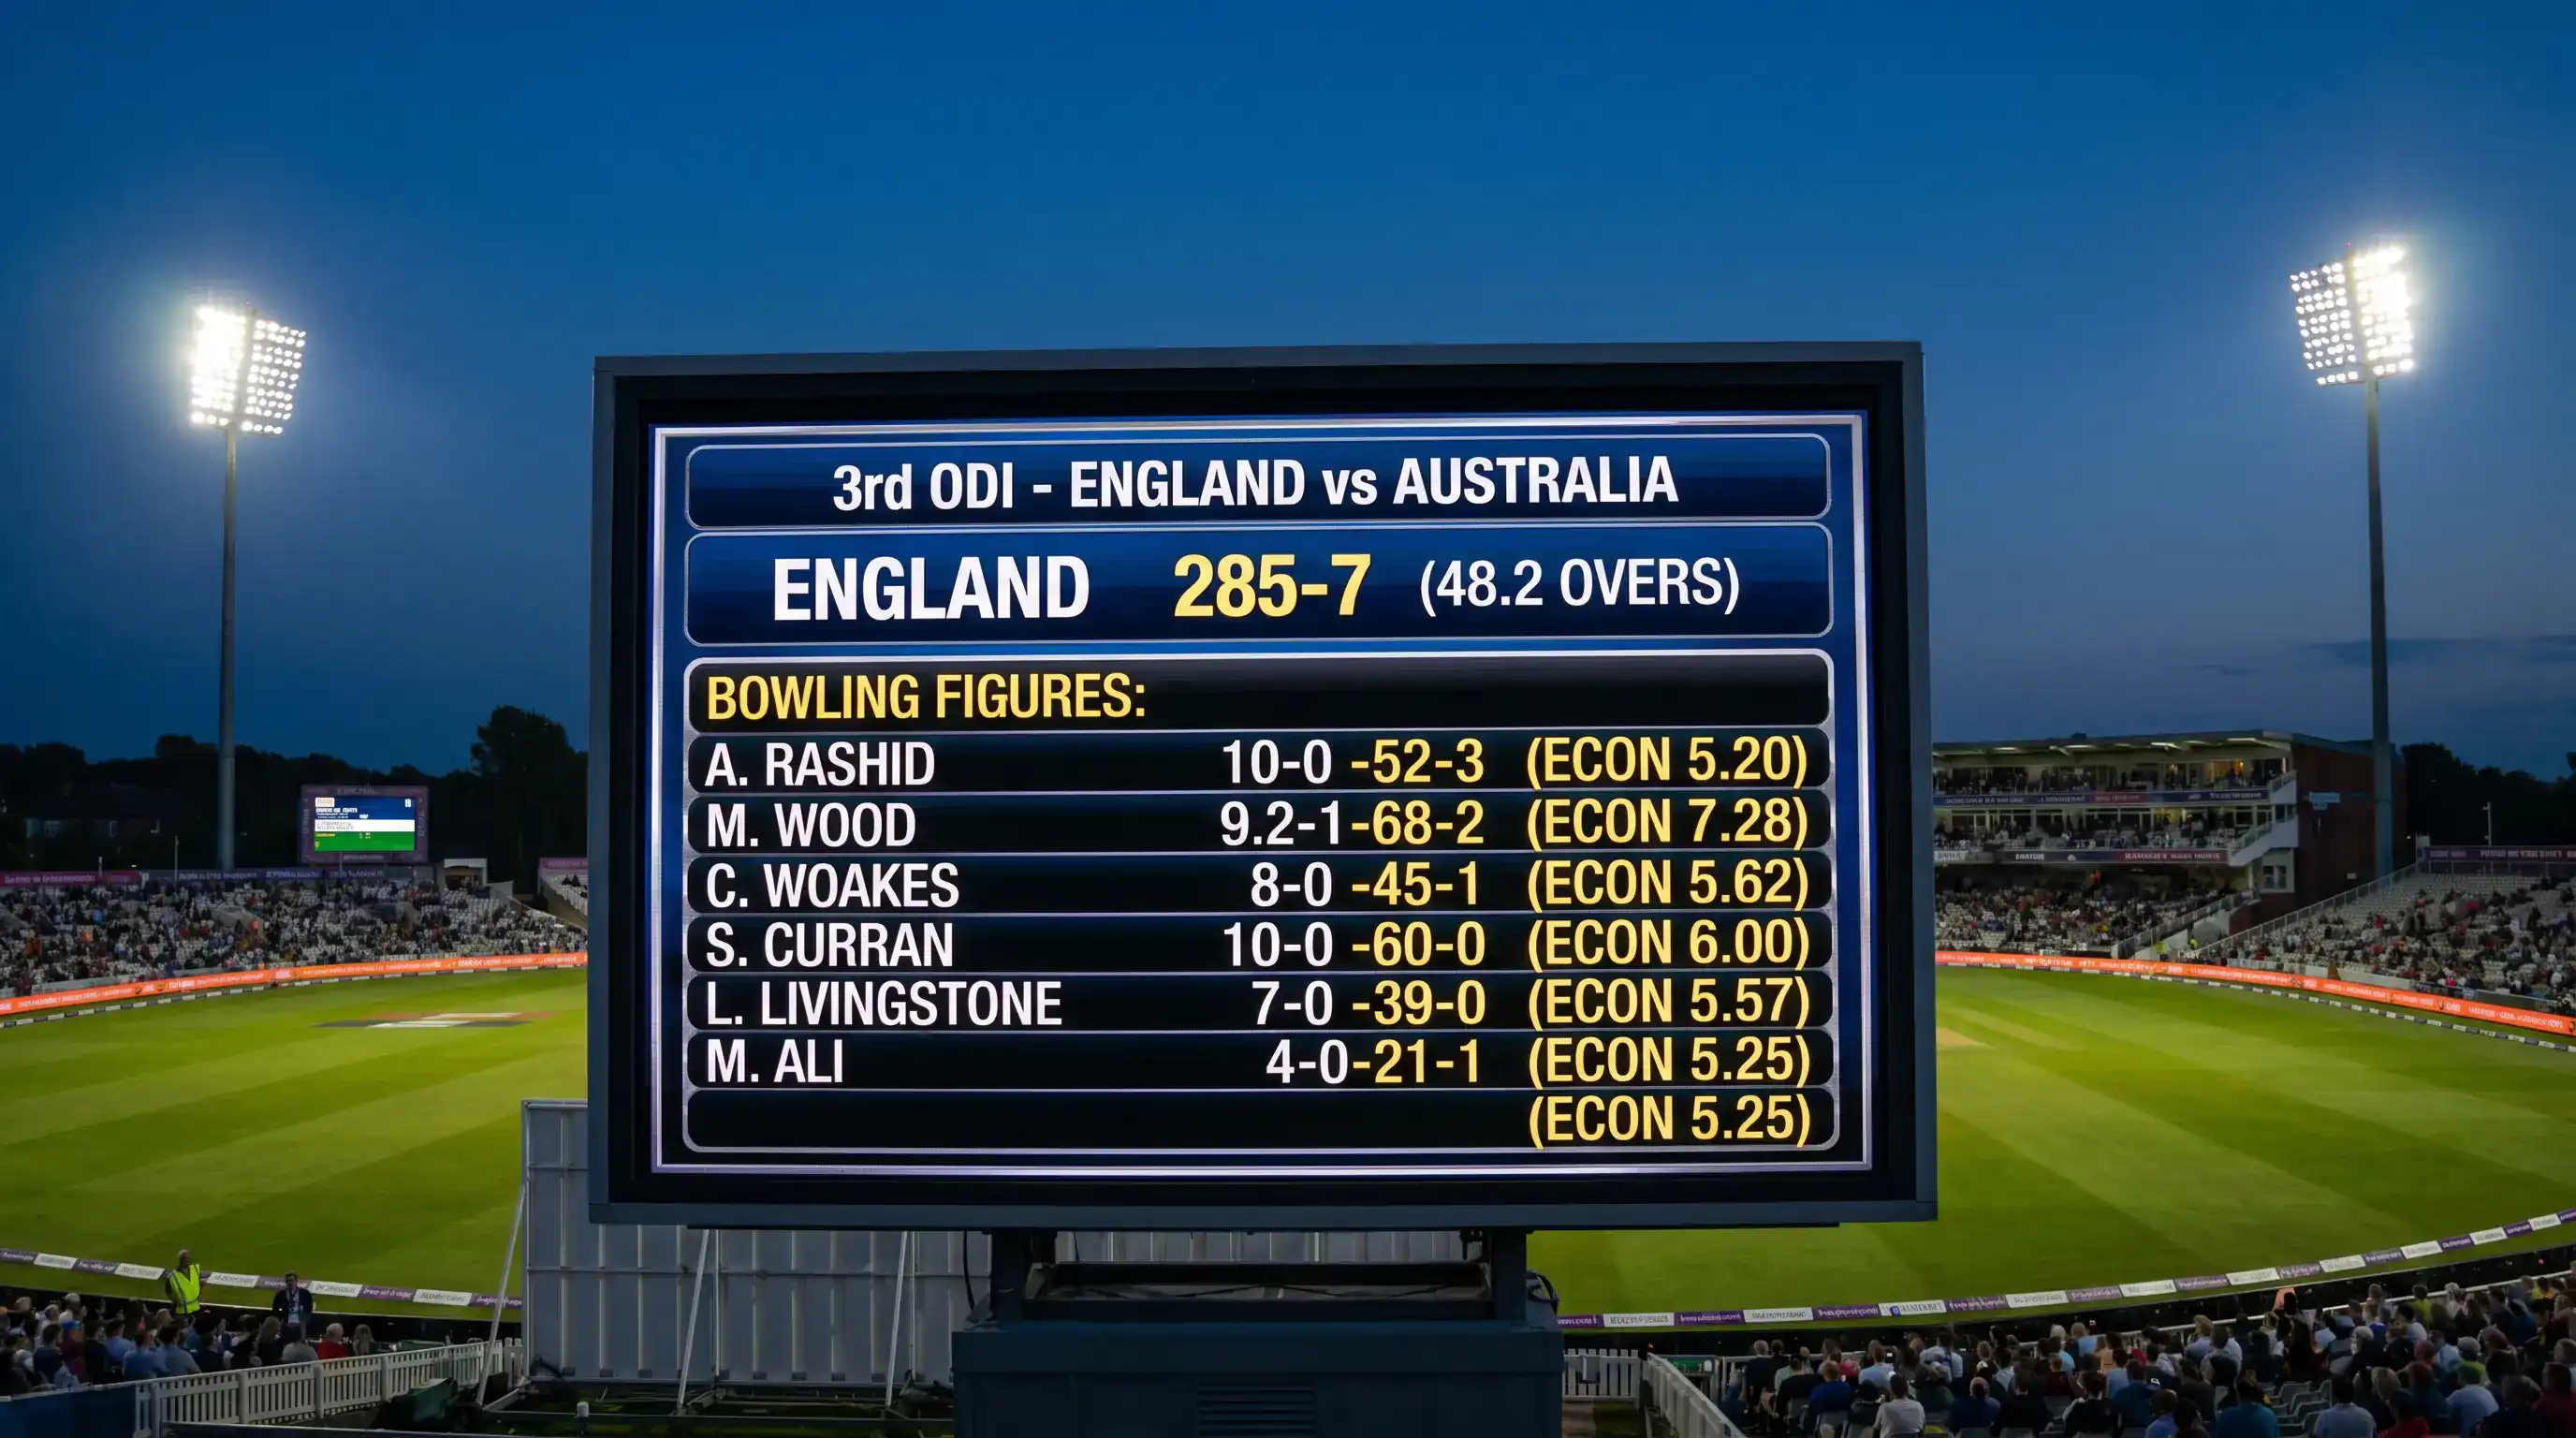
The seamer in the same matches has a different economy profile — usually around 3 to 3.5 in the County Championship, with the new ball giving a tighter economy in the first 20 overs and the older ball loosening as the innings develops. The two roles are not directly comparable on economy alone.
Reading the Bowling Figures Live
The habit that improves your reading of a match is to glance at the current economy rate of every bowler still available to bowl, and to mentally rank them. The captain is doing exactly this. The bowler with the lowest current economy who has overs left in their allocation is usually the next bowler on. If a different bowler comes on, the captain has a reason — match-up against the current batter, end preference, or a deliberate change of pace.
Watching the captain’s bowling decisions through the lens of economy rate is one of the cleaner ways to develop a sense of cricket strategy. The decision is not arbitrary. It is constrained by the over allocation, informed by the match situation, and driven primarily by the live numbers in the bowling figures. Once you start reading those figures the way the captain does, the rhythm of a limited-overs match starts to make a different kind of sense.
Created by the "Stumply" editorial team.
